Usage Insights for Users
Track your product usage and feature-level engagement in algoQA from the user dashboard.
How to Use Usage Insights for Users
Go to the dashboard and click the Launch icon next to Overview.
This will redirect you to the Insights page.

You can view user details such as email ID, business unit, status, total projects, total test cases, subscription, and validity.
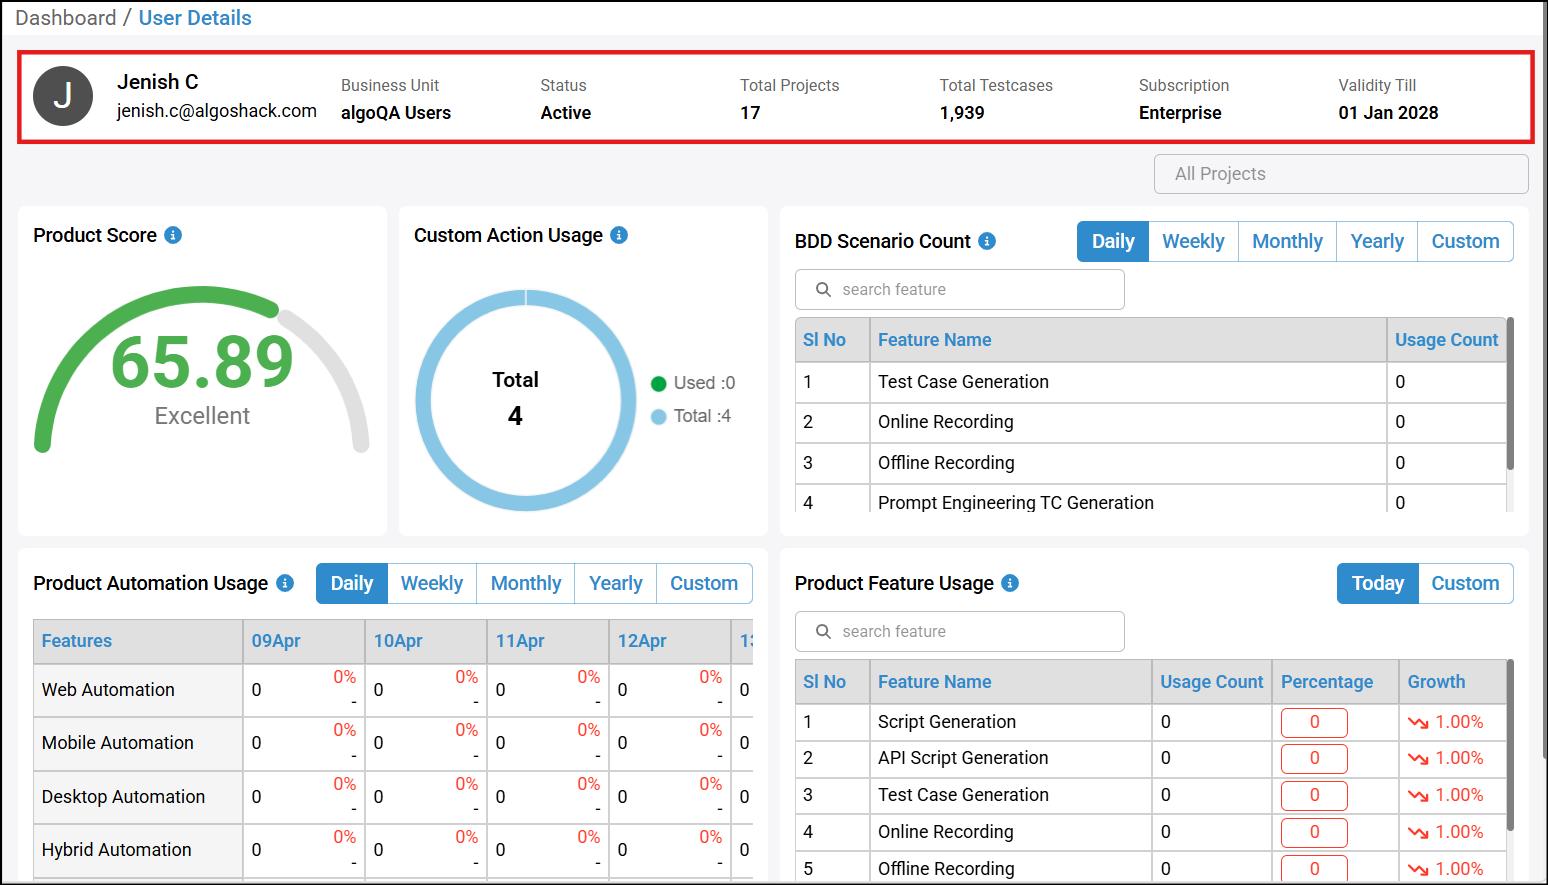
Select a project from the Projects dropdown.
By default, All Projects is selected.
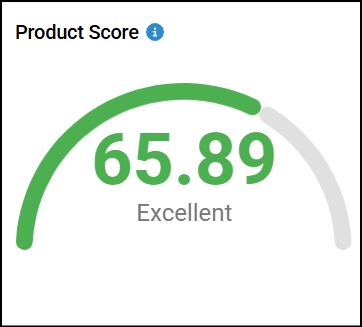
You can view the Product Score, which is calculated based on the usage of features in algoQA.
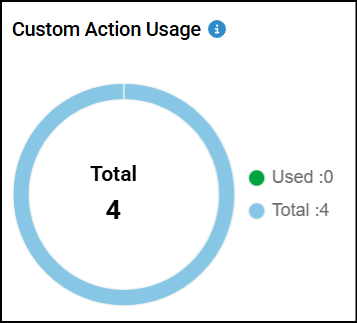
You can view Custom Action Usage, which shows the total number of custom actions available versus the number of custom actions used.
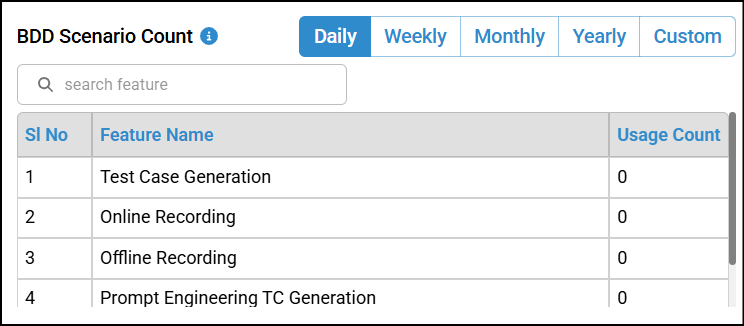
The BDD Scenario Count displays a table showing the number of scenarios created using different methods, such as online recording, offline recording, auto test case generation, prompt engineering, Jira issues to test case generation, and feature file to script conversion.
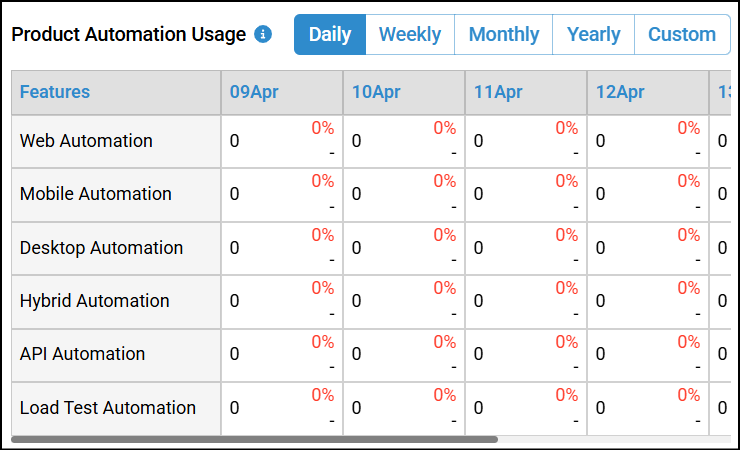
Product Automation Usage displays the usage of each automation type.
The usage percentage increases as you create projects across different automation types.
You can filter the data by daily, weekly, monthly, or custom time ranges.
This section provides insights into how users interact with the product, highlighting key usage metrics and trends to help optimize user engagement and overall satisfaction.
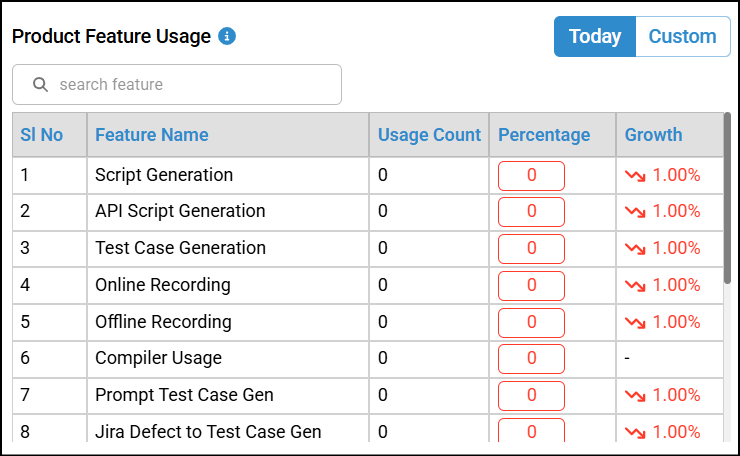
Product Feature Usage displays the usage of each feature.
The table displays both the usage count and the percentage of usage. You can also filter the data by today or a custom time range.