
How to Automate Web Applications
Automate web applications end-to-end using the Java Selenium Framework in algoQA — from scraping UI elements and profiling to executing scripts and viewing reports.
Use Case: Amazon Shopping Journey — Verifying the Cart Details
In this use case, you are shopping for a new laptop on an Amazon website, making selections based on specific requirements, such as brand, filtering options, adding items to the cart, and proceeding to check out for a purchase.
Using algoQA, you can automate this workflow through the following stages:
Prerequisites
- Use algoScraper for Application Scraping
- The algoScraper tool, available as an extension, serves the purpose of capturing all User Interface (UI) elements and X-paths present on a web page. To integrate this tool into your Chrome or Edge browser, visit the algoScraper Chrome Web Store page.
- Scrape all the required UI elements and download the file in the .json format. For more information on scraping UI elements and tool information, see algoScraper as an Extension for Web Applications.
- The downloaded spreadsheet contains comprehensive details of UI elements.
Ensure that all page names in the scraped file are the same as the UI elements' names.
- Supported framework for Windows: Java Selenium
- The framework requires Java and Maven as key components.
- To install the latest versions of Java and Maven, refer to the Installation Steps for Java Selenium Framework.
Profile the Application
Profiling is the process of creating an offline model of an application under test (AUT), which involves mimicking a UI model of an AUT using nodes, features and UI elements.
Profiling involves:
-
Create an Offline Model: To create an offline model, see Offline Model.
-
Recording the scenarios using Offline Recorder.
The Record Scenario feature is used to record and save the workflow, scenario, or use case. The scenario will be saved in the same sequence it has been recorded.
Note: Recording of a scenario with Offline Recorder feature is done in an offline model. It doesn't interact with the live application.
-
Generating Test Cases and Test Scripts
Test cases are generated in Gherkin language and are Behavior-Driven Development (BDD) compliant.
For more information, see Generate Test Cases and Test Scripts.
You can also generate test cases using Auto Generate Test Cases machine learning feature. For more information, see Auto Generate Test Cases Feature article.
Execute Scripts
Perform the following:
- Once the scripts are generated, click View Scripts to view the scripts folder.
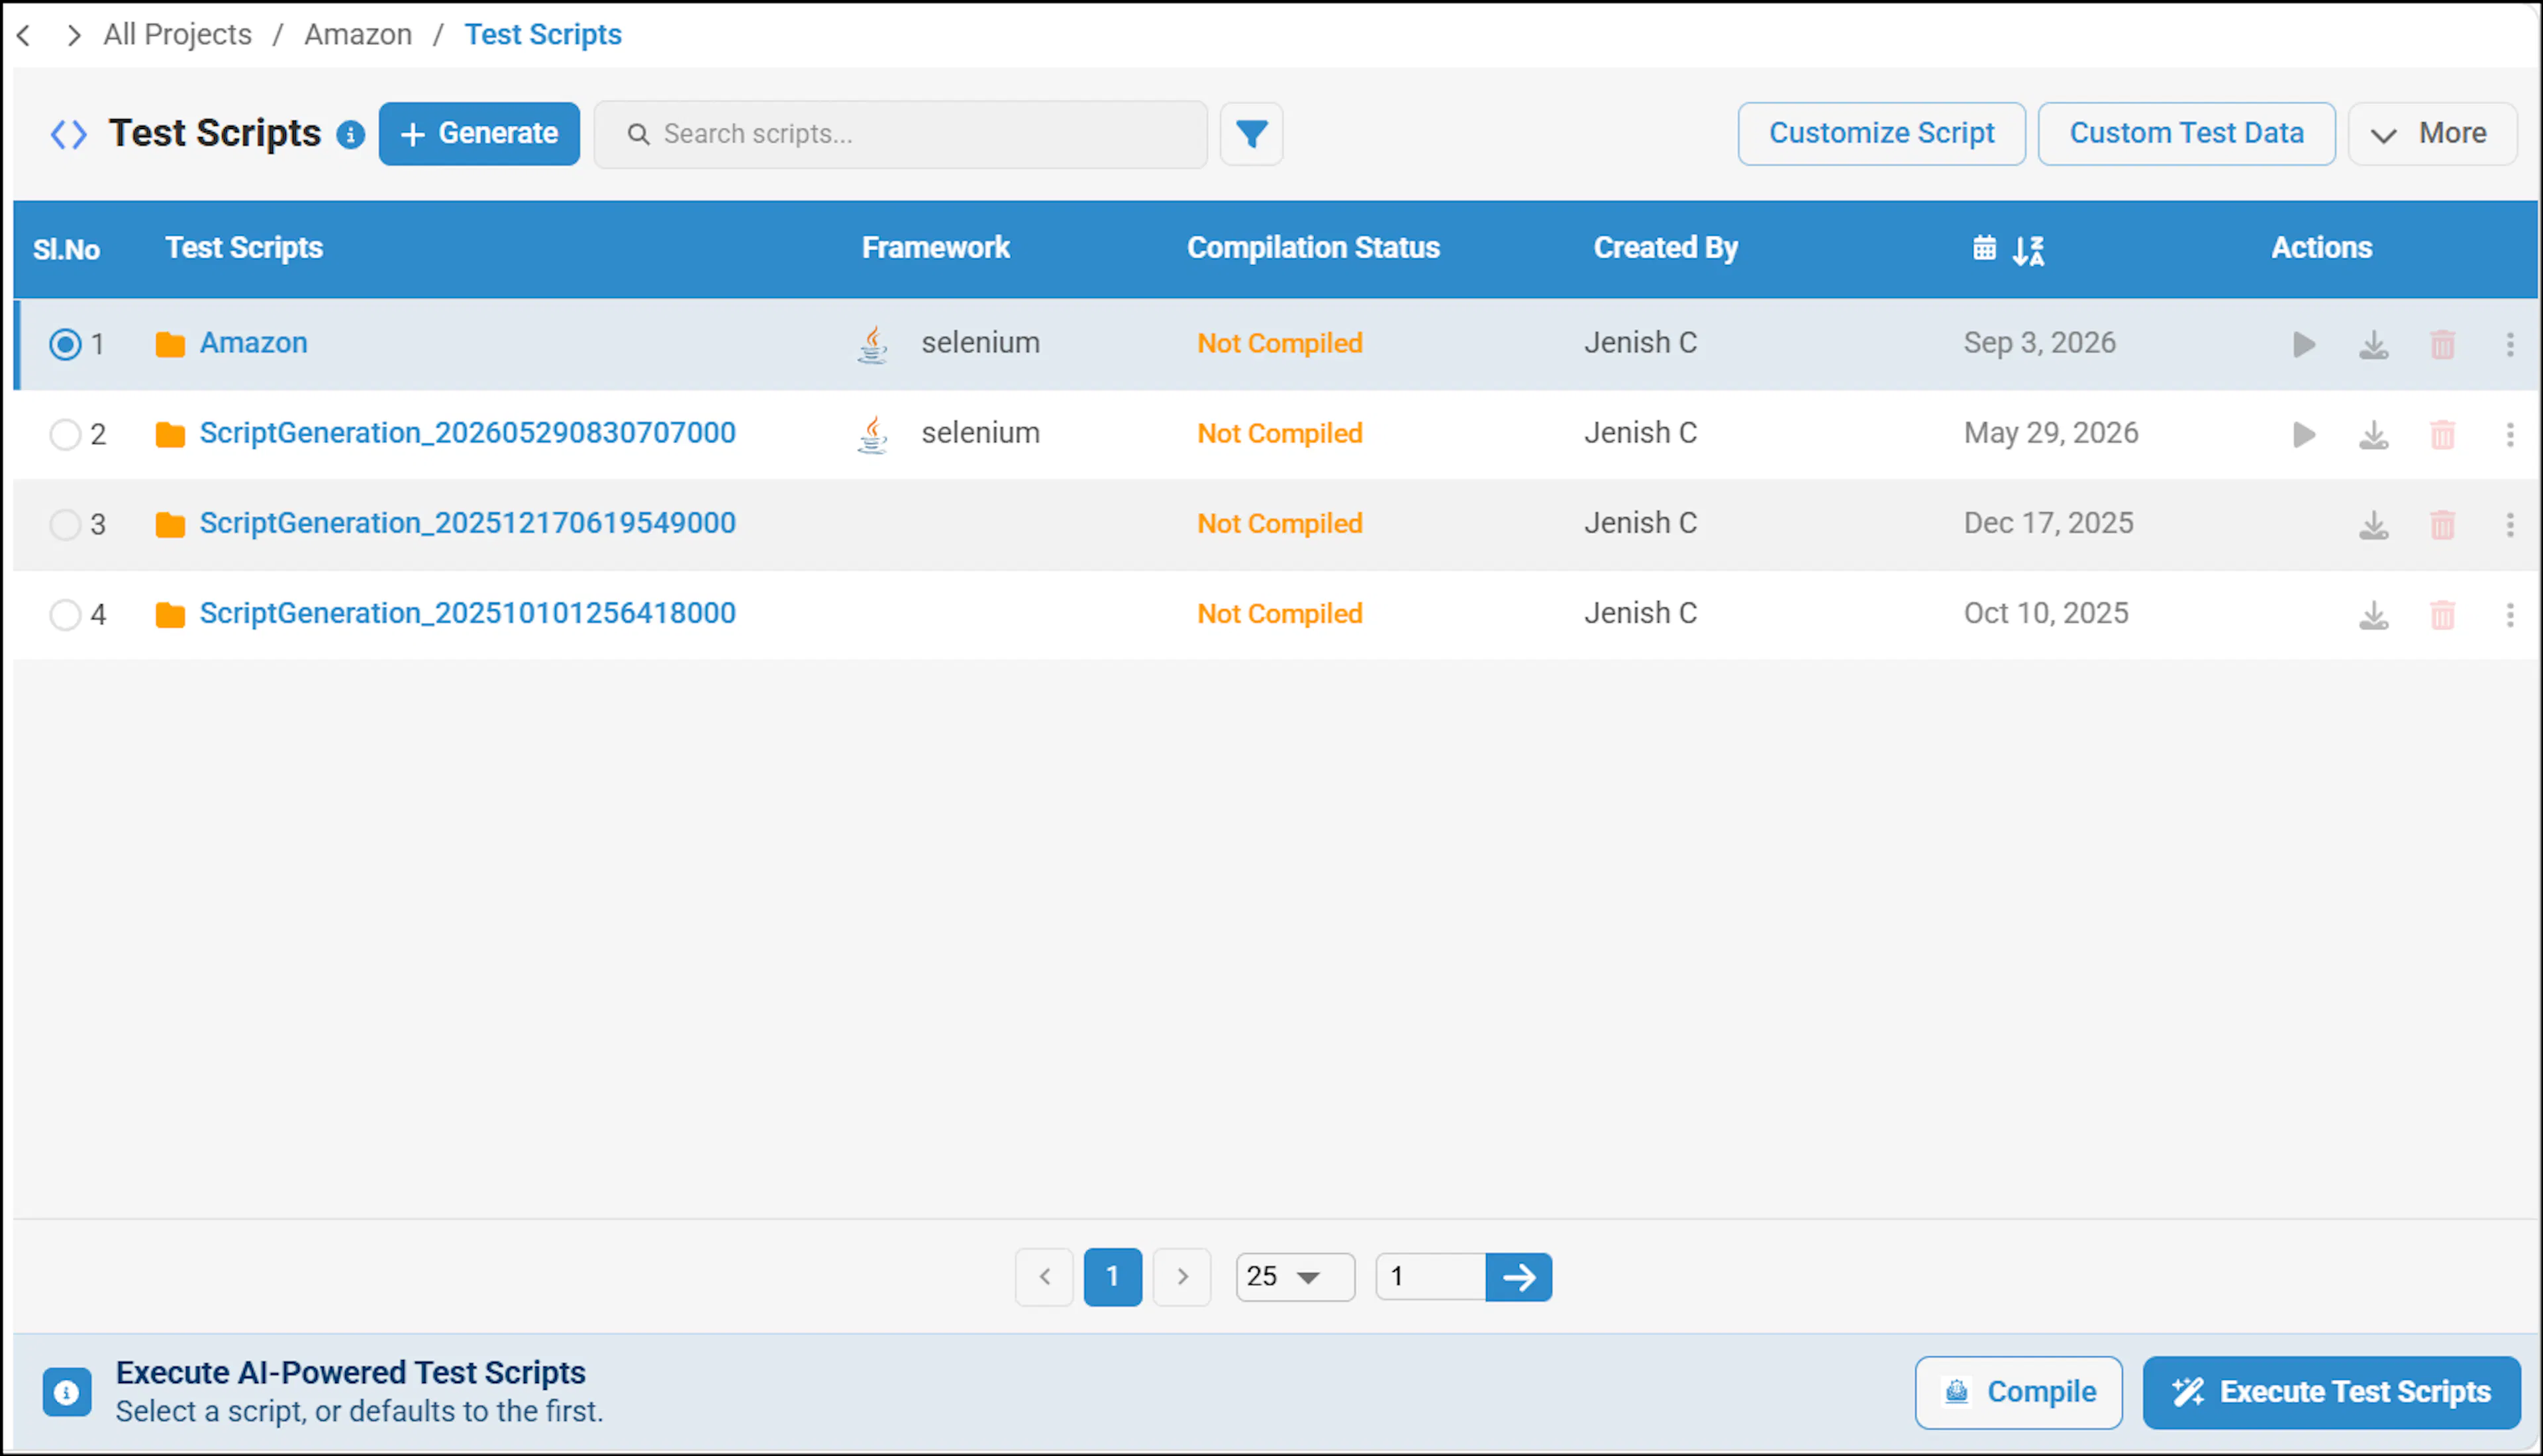
- This page allows you to view scripts along with their framework, compilation status, creator, and creation date and time. From this page, you can also execute, download, or delete the scripts. To execute scripts in algoQA, refer to Online Script Execution.
- Once the script is generated, you can compile it by selecting the Compile button on the Script Generated Successfully screen.
- The Script Editor screen will appear and the script will begin compiling. The system checks for syntax errors during this process. If any errors are found, the Compiled Log Details will show a Build Failure status; if no errors are detected, the build will pass.
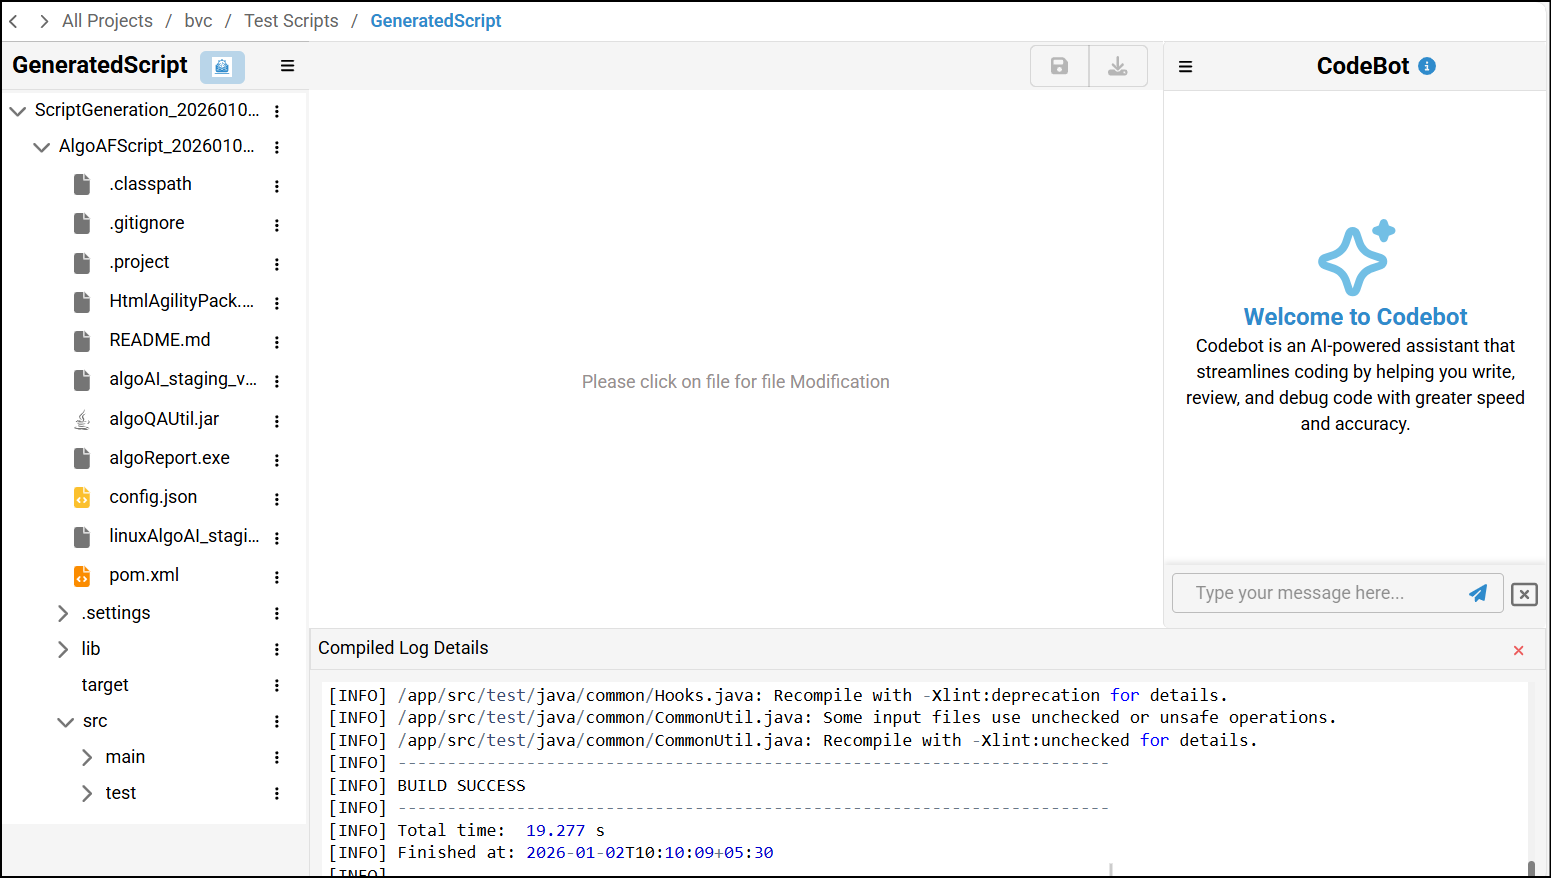
- If the build fails, check the Compiled Log Details to find the exact step and file path where the error occurred. Navigate to that path, update the parameters causing the issue, and then click Compile to recompile.

- You can also view the compilation status on the Test Scripts screen.
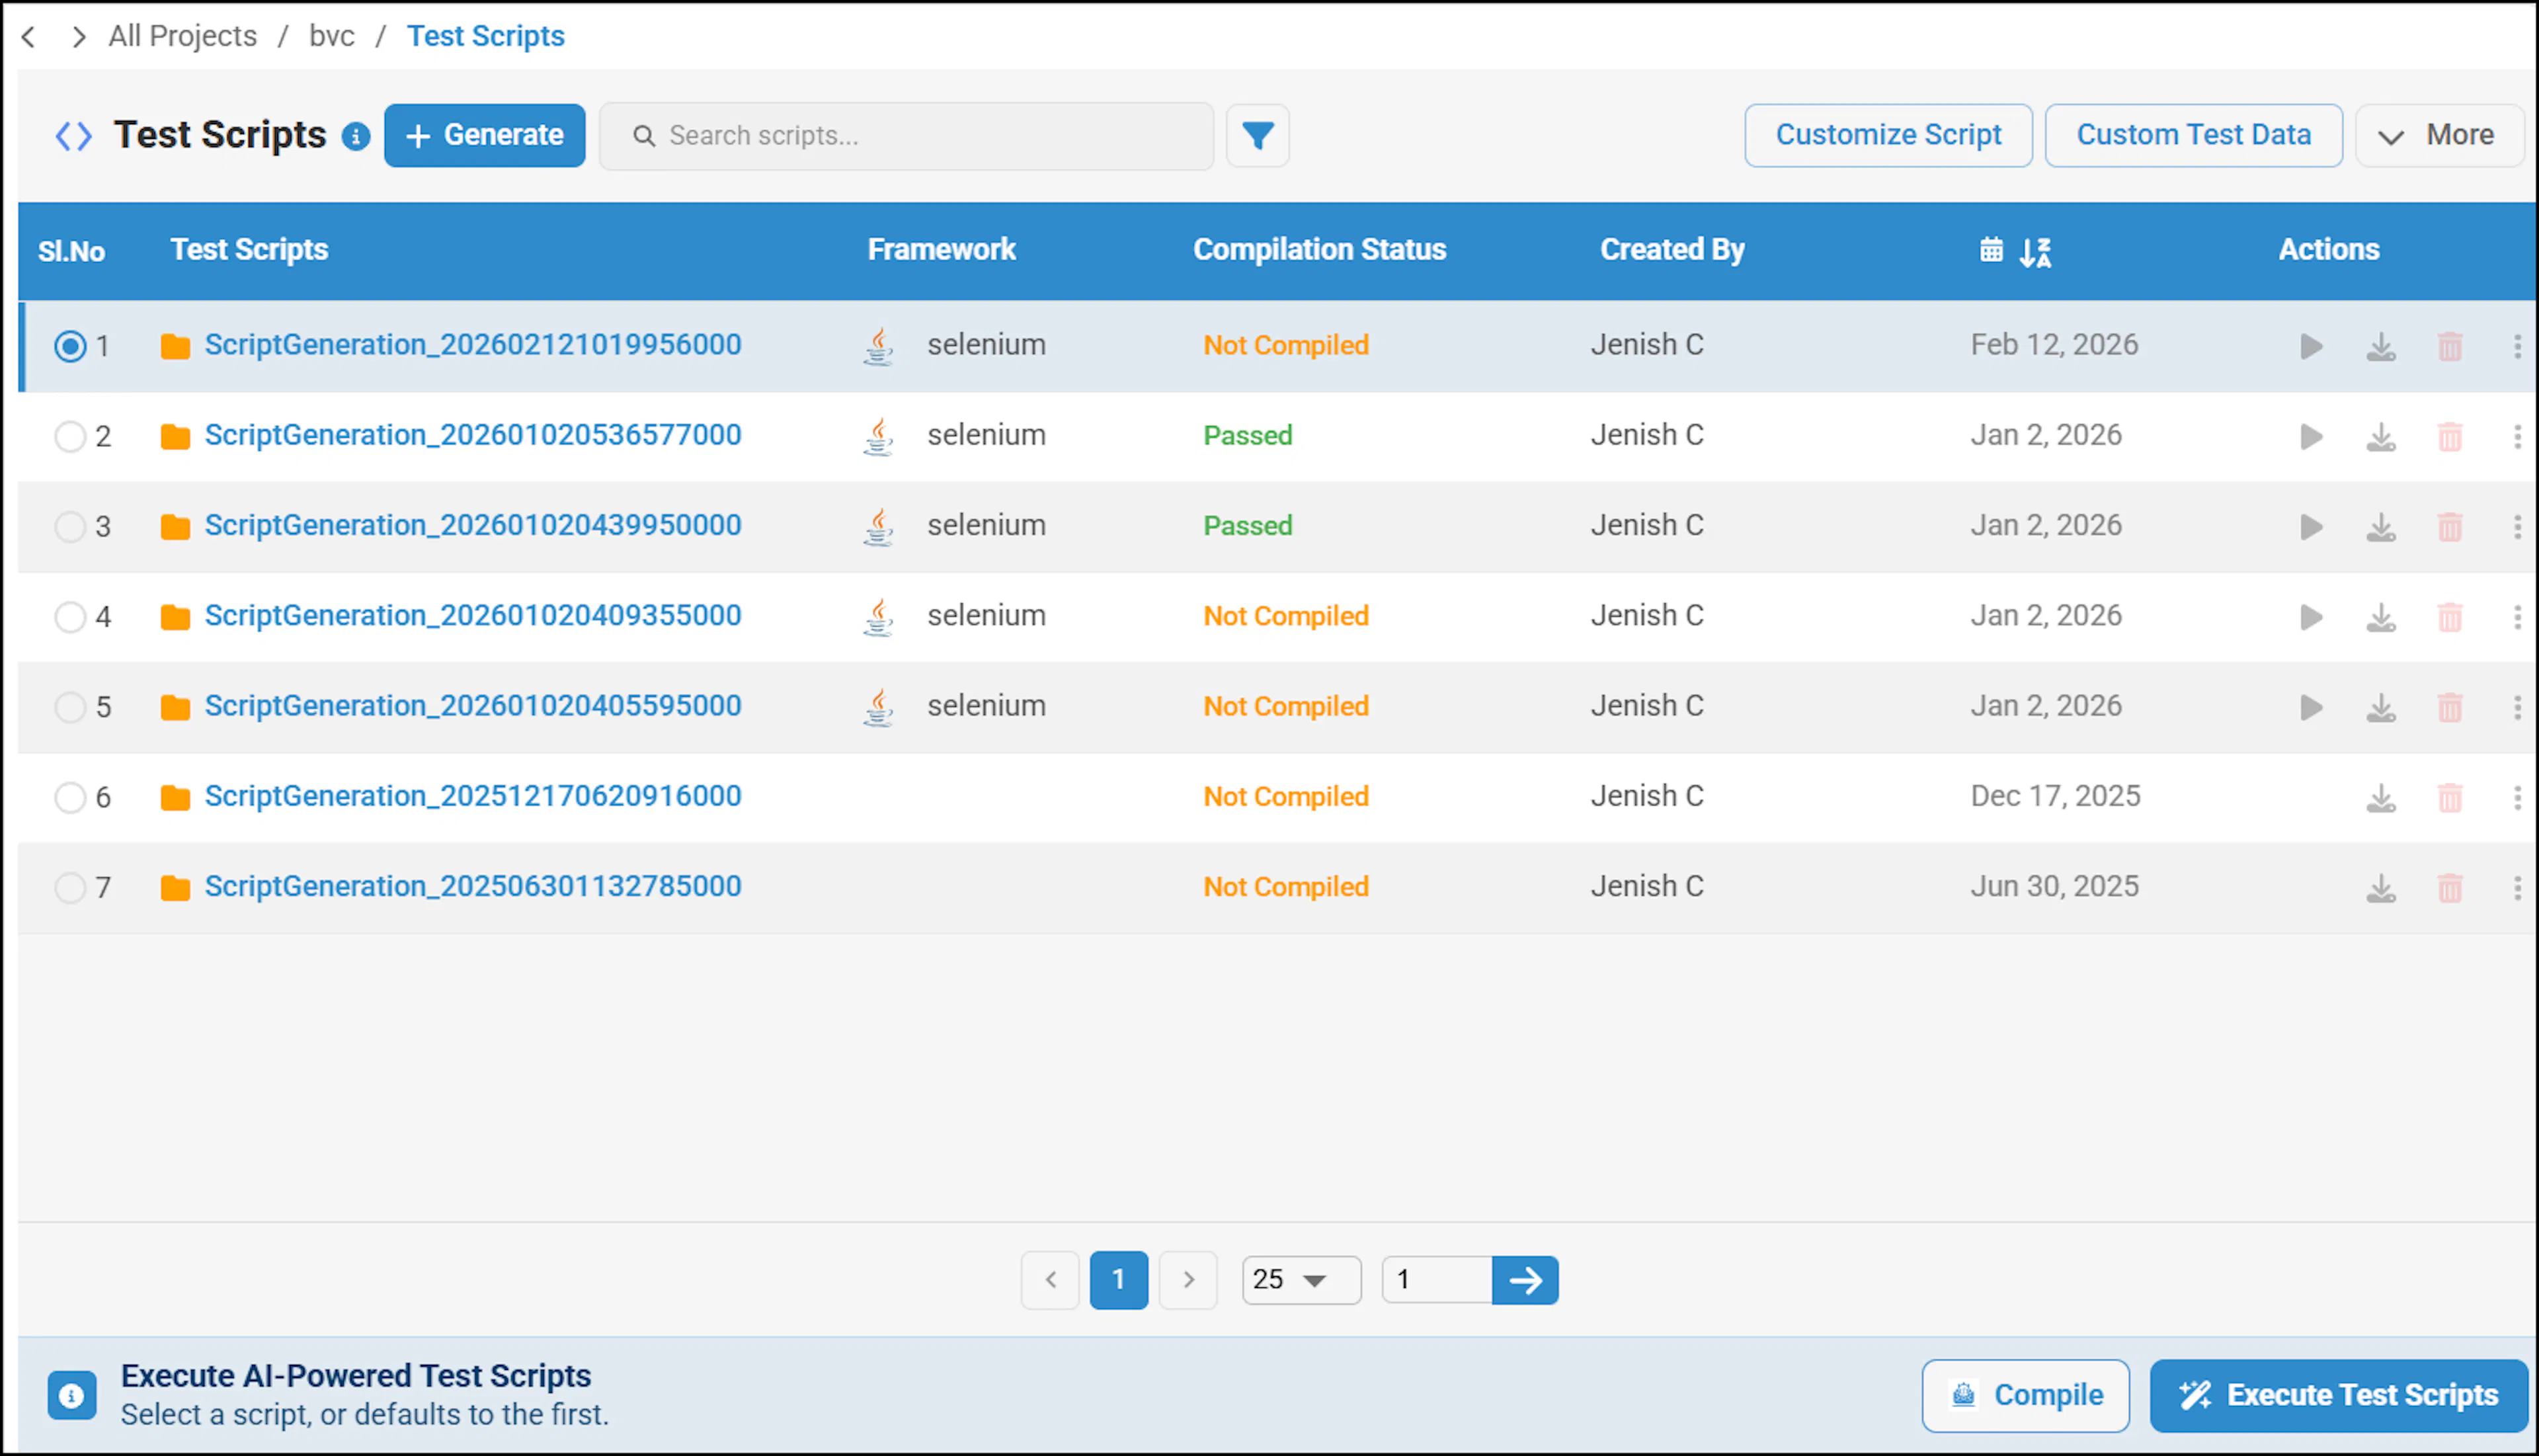
Test Scripts screen showing compilation status for generated scripts - Execution of scripts on a Windows machine:
-
Navigate to the generated script folder, and click the download icon to download the script.
-
Download and extract the script to your local folder. Navigate to the same folder.
You'll find the feature files in the scripts folder which you selected before generating scripts.
-
In the folder navigation bar, type cmd and press Enter to open the Command Prompt.
-
Run the following command to trigger the script:
mvn test -
This command will execute the script using Maven, as shown:

-
Wait until the Build Success message is displayed, which indicates that scripts have been executed successfully.

For Web Automation with the Java Selenium framework, there is no need to create custom actions for the following capabilities, as they are handled automatically by the framework during execution.
- Auto Scroll: Automatically scrolls an element into view before performing any action, eliminating the need to add explicit scroll steps.
- Auto Wait: Automatically waits until an element is visible, enabled, stable, and ready for interaction, removing the need for explicit wait statements.
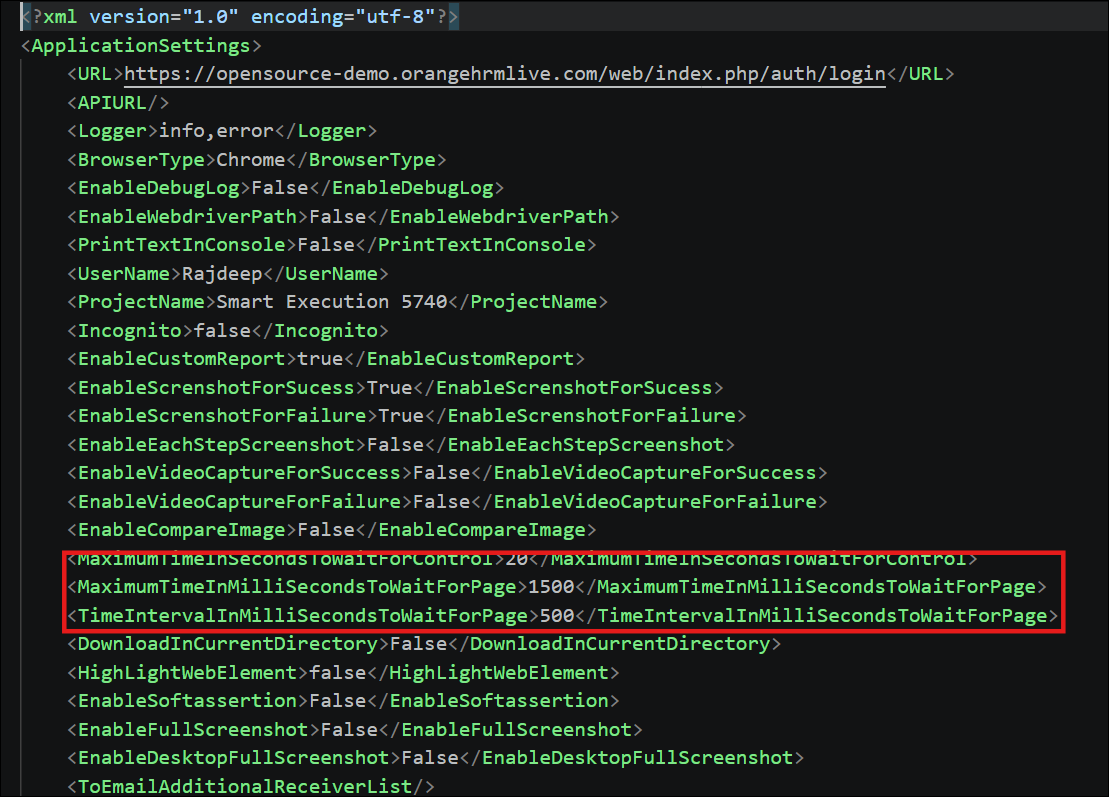
- Wait Optimization: Efficiently utilizes the configured wait timeout by continuously checking for element readiness and proceeding as soon as the element becomes available, instead of waiting for the entire timeout period. This improves execution speed. The wait timeout can be configured in the Application Settings.
-
You can view the corresponding report in the Output folder, as shown:

-
Reports will be generated in Spark and PDF formats, as shown:

-
The sample PDF report is shown below. It includes the following details:
- Test Results: Number of test cases that passed and failed.
- Execution Time: Total duration taken to execute features, scenarios, and steps.
- Step Details: You can view preceding information for each test step by clicking the feature name link.
- Screenshots: You can also view screenshots for each verification step.

-