
Smart Ordering
This document provides detailed information on the Smart Ordering feature and how to use it to view execution reports in detail, including criticality, test runs based on scenarios, and more.
Smart Ordering is available for Web (Java Selenium, Python Selenium, TypeScript Playwright, and JavaScript Selenium), Mobile (Java Appium), Desktop (Python Squish and Python TestComplete), and API (Java Selenium) automation frameworks.
How the Smart Ordering Feature Works
It simplifies the way you view execution reports in the dashboard. You can see details such as execution time, criticality, test case age, tags used, and individual scenario details.
How to Use the Smart Ordering Feature
A feature file may contain multiple test cases, and when all these test cases are executed, a report is generated. This report can be uploaded to the dashboard by specifying a batch name. Each batch can contain multiple test cases, and these test cases will be displayed on the dashboard, organized under their respective batch name.
To view the results in the dashboard, follow these steps after generating the script:
- Download the script and open the generated script folder.
- Inside the folder, open the Command Prompt.
- Run the following command: java -jar algoQAUtil.jar -dashboard
- When prompted, enter the Execution name and press Enter.
- When prompted, enter the TestSuite name and press Enter.
- Once completed, the messages "Report uploaded successfully" and "Data inserted into the dashboard successfully" will appear in the Command Prompt, confirming that the report has been uploaded to the dashboard.

To view execution details, navigate to algoQA > Dashboard, then click on Filter and enter the respective project name for which the report was generated and click on Apply. The execution details for the selected project will be displayed.
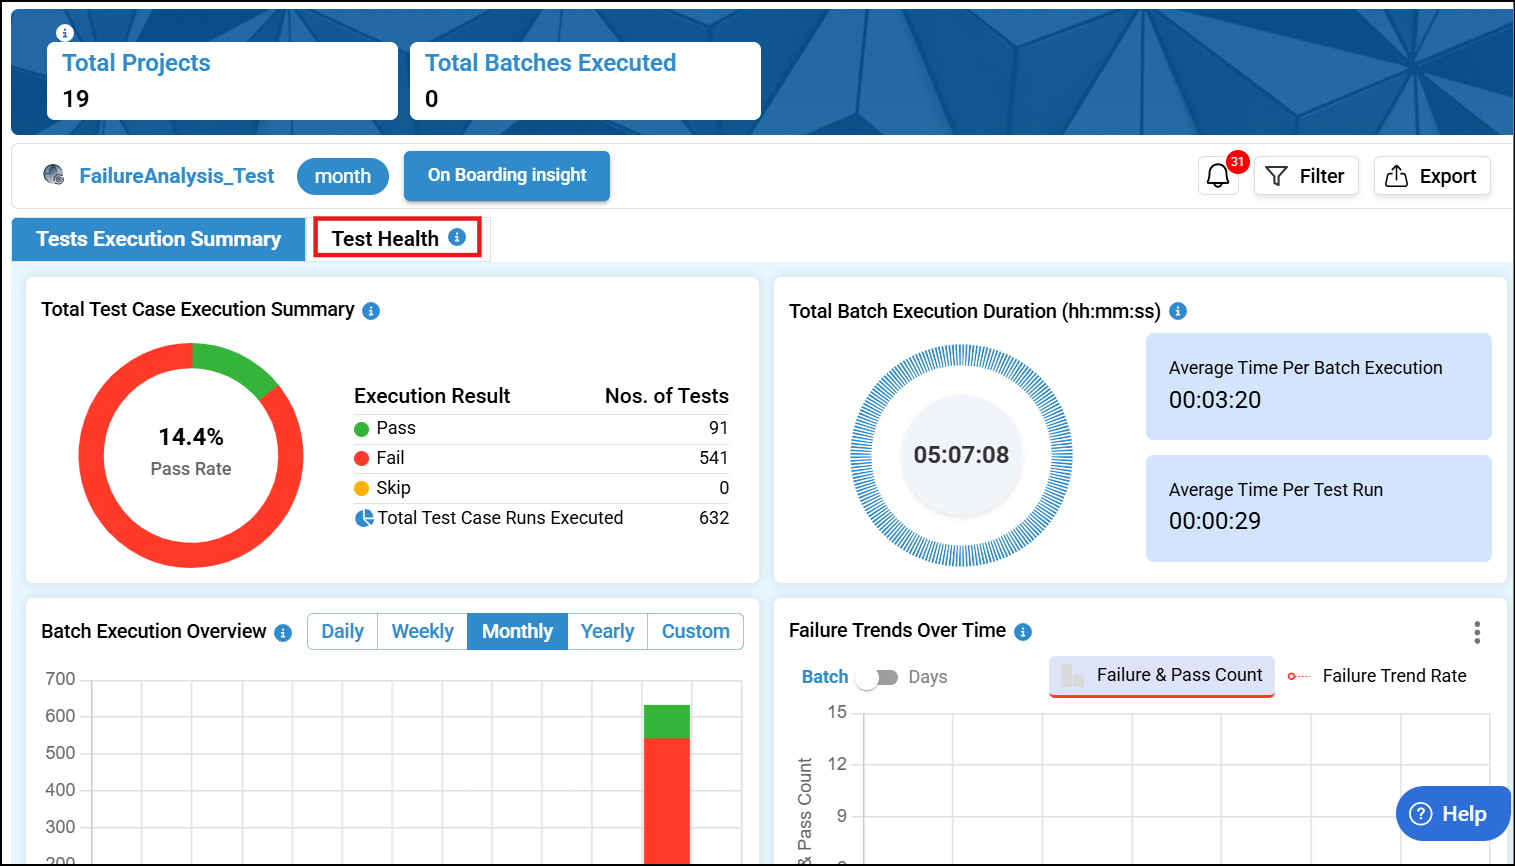
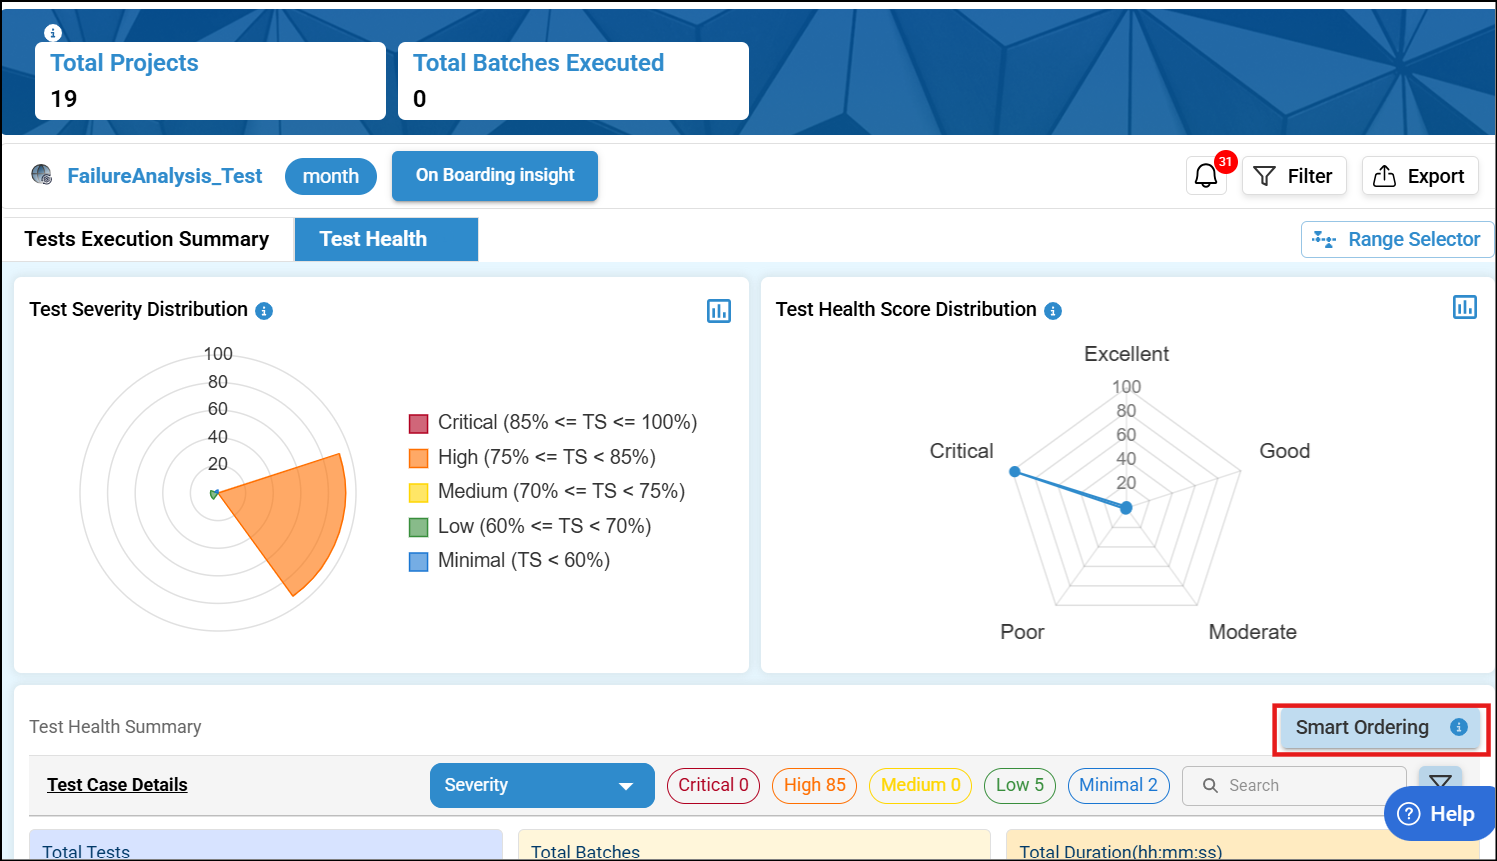
Click on Test Health to view the Test Health Summary, then click on Smart Ordering.
By clicking on Smart Ordering, you will be redirected to the Smart Ordering screen. Here, you can view a pie chart showing the count of scenarios categorized as Critical, Recovering, and Stable, along with the total number of scenarios.
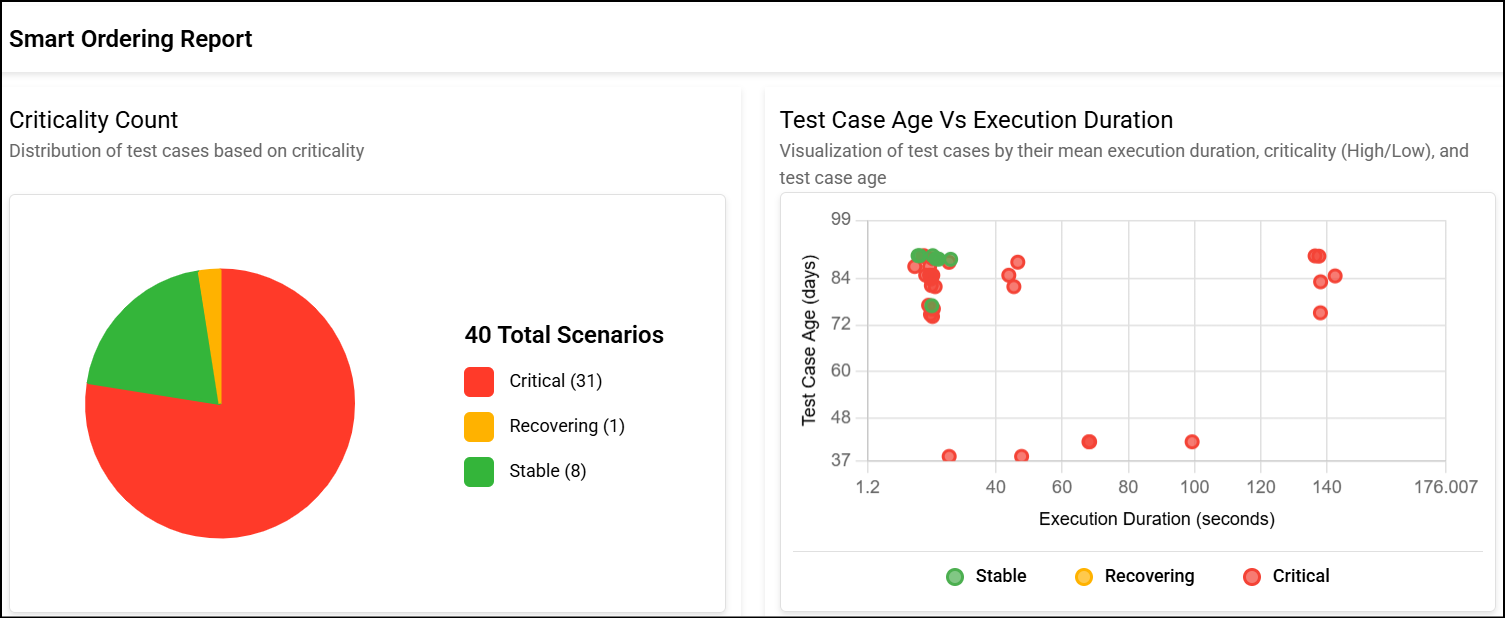
Additionally, there is a Test Case Age vs. Execution Duration graph, where:
- Red represents Critical scenarios
- Yellow represents Recovering scenarios
- Green represents Stable scenarios
Hovering over any point on the graph will display details for each scenario, including Scenario Name, Duration, Test Age, Criticality, and Tags.
Below the graph, the Smart Ordering Summary lists test cases by scenario name. Note that a single scenario can appear in multiple batches.
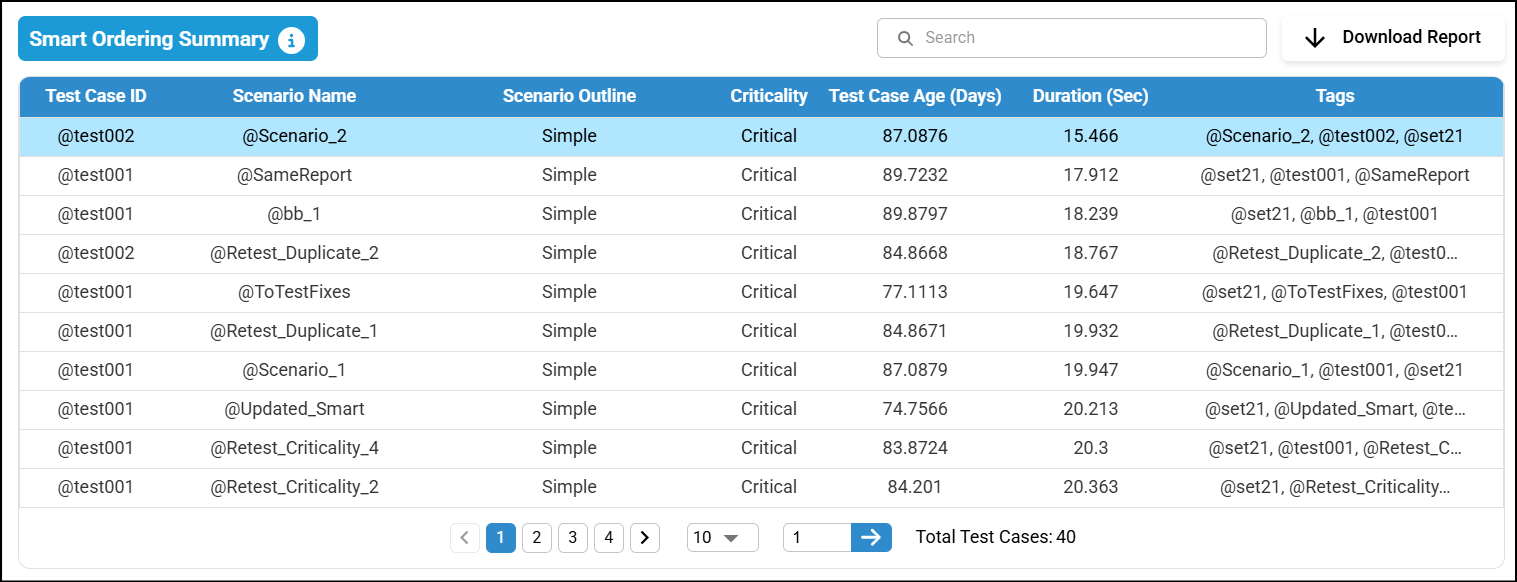
In the Smart Ordering Summary, you can view the following details for each test case:
- Test Case ID
- Scenario Name
- Scenario Outline
- Criticality
- Test Case Age (Days)
- Duration (Sec) – the time taken to execute the scenario
- Tags – taken directly from the feature file
Test cases are grouped and displayed based on their criticality:
- Critical scenarios are listed first
- Recovering scenarios are placed in the middle
- Stable scenarios are listed last
Within each group, test cases are sorted by execution duration in ascending order, making it easier to prioritize shorter, high-impact tests.
By clicking on a scenario in the Smart Ordering Summary, you can view its details in the Test Details section. Here, you can see the total number of times the scenario has been executed, how many times it has failed, and how many times it has passed.
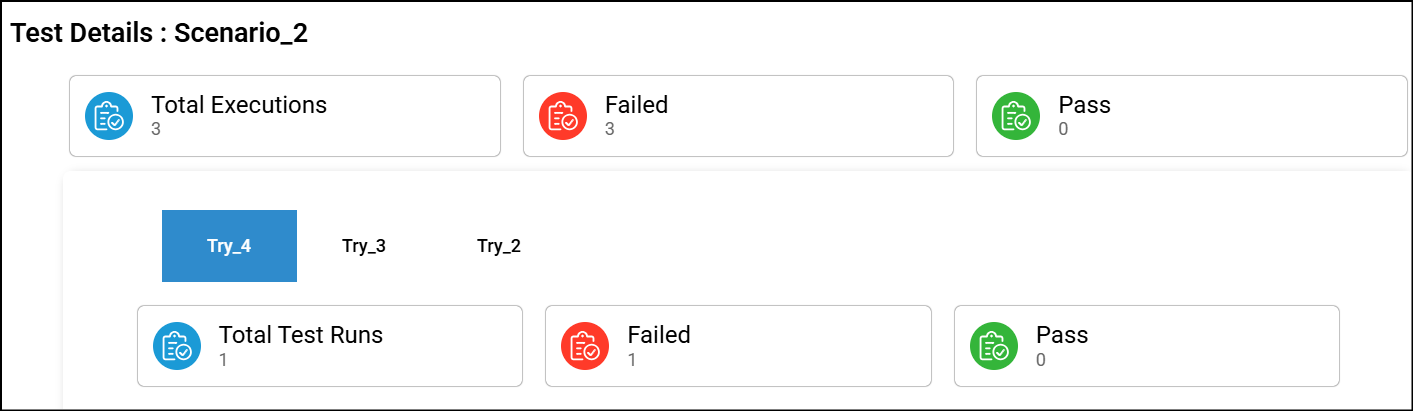
Below that, you can also view the batch names in which this scenario is included. The batches are ordered with the most recent first and the oldest last. If the oldest batch is executed again, it will move to the top as the latest batch after execution.
By clicking on each batch, you can view the batch details where the selected scenario is present. Here, you can see the Total Test Runs, which represents the number of test runs for a particular feature file with different test data sets available under the examples section in the feature file. You can also see how many tests failed and how many passed.
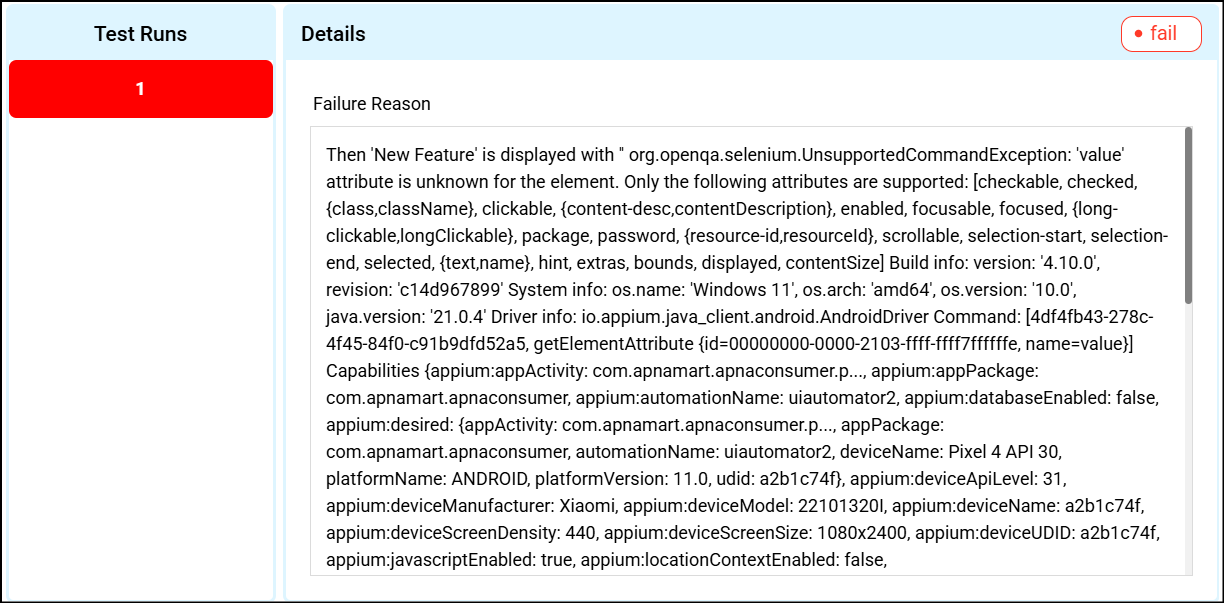
If there are any failed test runs, a table will appear below showing the failed test runs highlighted in red, along with failure reasons under the details column. If there are no failures for a test run, no details will be displayed in the table. You can view the failure reason only by clicking on the specific failed test run.
What is the Method Used to Categorize Criticality
Criticality is determined based on the execution history of a particular scenario, considering how many times it has been executed and whether it has been passing or failing recently.
There are three categories:
- Critical: Scenarios that have been failing recently.
- Recovering: Scenarios that were failing previously but are passing recently.
- Stable: Scenarios that are consistently passing.
To determine criticality, the latest five executions of a scenario are first evaluated. If any one of these five executions has failed, the scenario is classified as critical.
If all five executions have passed, then the entire execution history is considered using an exponential decay method. This method assigns higher weight to more recent executions and lower weight to older ones, calculating a criticality score that ranges from 0 to 1.
- A score closer to 0 indicates recent failures.
- A score closer to 1 indicates recent passes.
Based on this score, scenarios are categorized as follows:
- Critical: 0 to 0.4
- Recovering: 0.4 to 0.8
- Stable: 0.8 to 1
The exponential decay method is applied only when all of the latest five test runs have passed.
Below is an example of the exponential decay method and how it is used to calculate the criticality score:
9 total test runs (1 batch, for one test case)
- Latest 5 = Pass → status = 1
- Older = Fail → status = 0
- i (Run Index) = 0 → Latest execution
- i (Run Index) = 1 → 2nd latest execution
- i (Run Index) = 2 → 3rd latest execution, and so on
| i (Run Index) | Status | 0.95^i(weight) | status × weight |
|---|---|---|---|
| 0 | 1 | 1.0000 | 1.0000 |
| 1 | 1 | 0.9500 | 0.9500 |
| 2 | 1 | 0.9025 | 0.9025 |
| 3 | 1 | 0.8573 | 0.8573 |
| 4 | 1 | 0.8145 | 0.8145 |
| 5 | 1 | 0.7737 | 0.7737 |
| 6 | 1 | 0.7350 | 0.7350 |
| 7 | 0 | 0.6983 | 0 |
| 8 | 0 | 0.6634 | 0 |
Weighted Score = Sum of (status × Weight)
Total Weight = Sum of weights
Final criticality score = weighted score / total weight
After the latest five test runs have all passed:
- Approximately 22 failing runs (from run 5 to run 26) are needed to lower the criticality score to 0.3.
- Just 3 older failed runs (at runs 5, 6, and 7) are enough to reduce the criticality score to 0.7 or below.
Based on the number of older failed runs:
- 2 to 11 failed runs indicate a Recovering status.
- 12 or more failed runs indicate a High (Critical) status.
Advantages
You can view detailed information on a scenario-by-scenario basis, including the criticality of each scenario. This helps you identify which scenarios require higher priority during testing.
Limitations
In Smart Ordering, if a user is trying to add an execution report and a customized script is used, the latest JAR file will not be updated automatically. In the existing customized script, the latest JAR file must be uploaded manually.