Smart Report Analysis
Review and analyze test failures on the algoQA dashboard — view execution results, failure categories, auto-healing insights, and detailed failure information for each batch, and export reports for sharing and tracking.
How to View Failure Analysis
To view the execution report in the dashboard, see the Uploading Execution Reports to the Dashboard section in the Dashboard article.
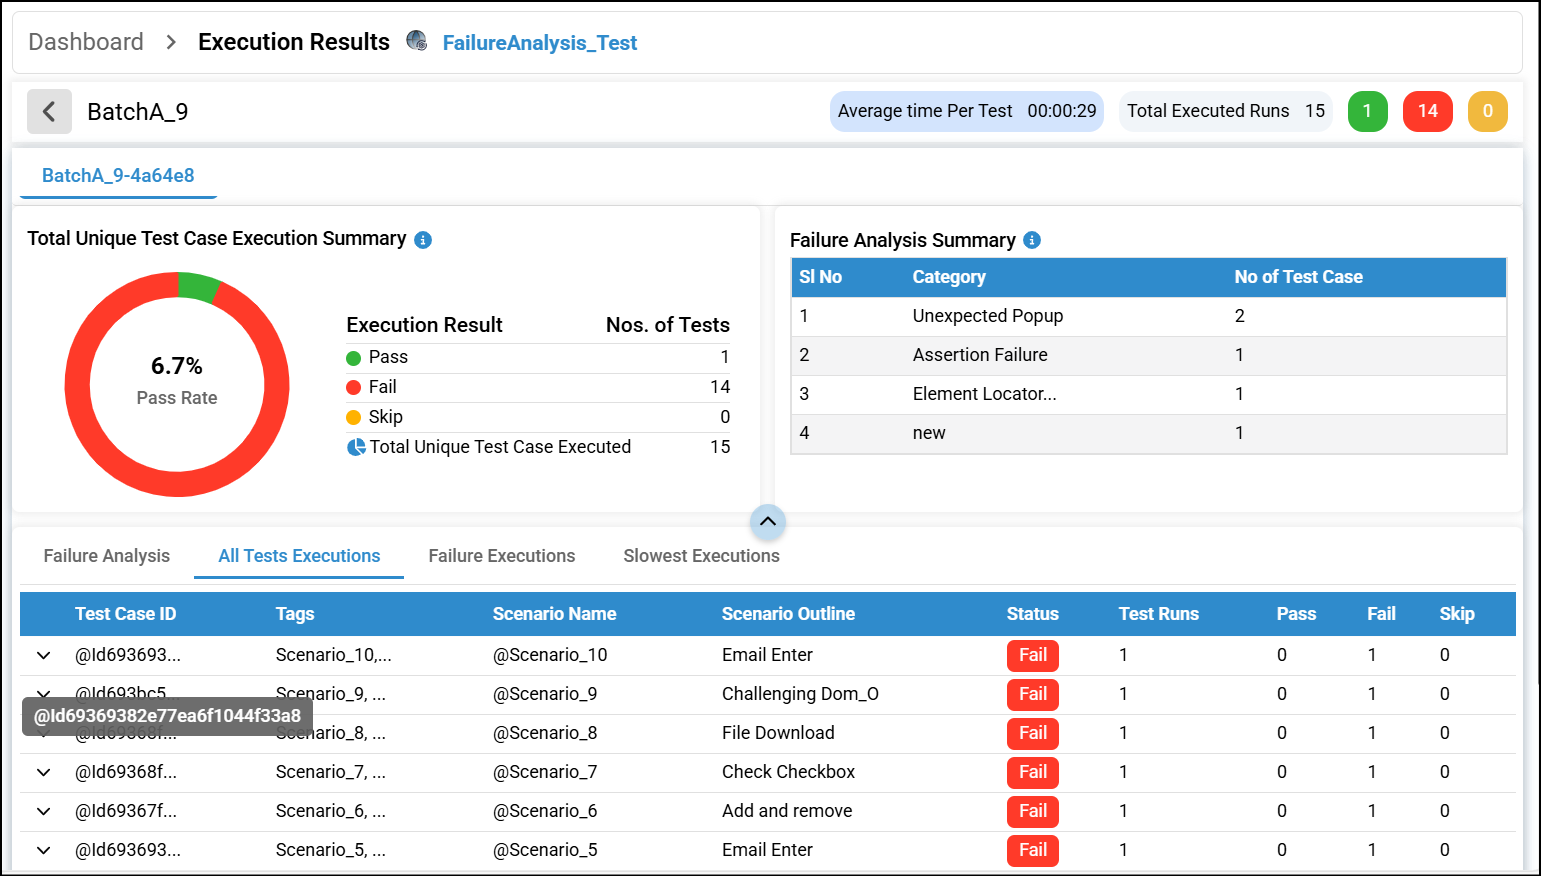
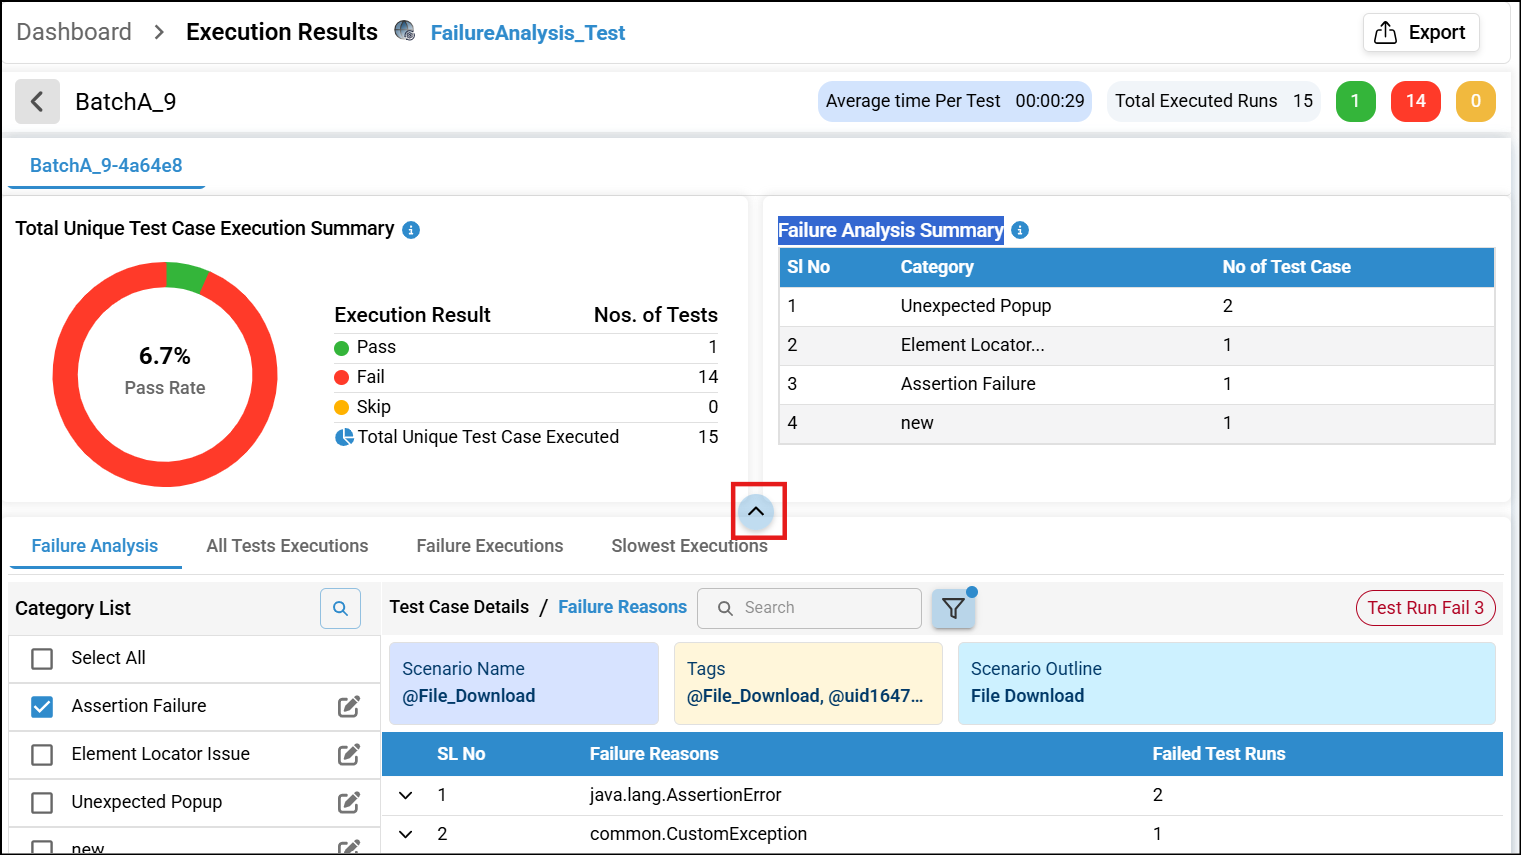
In the dashboard under Test Execution Summary, click a batch in the Batch Execution Summary table to view the Total Unique Test Case Execution Summary, Failure Analysis Summary, Auto-Healing Insights, Failure Analysis, All Test Executions, Failure Executions, and Slowest Executions.
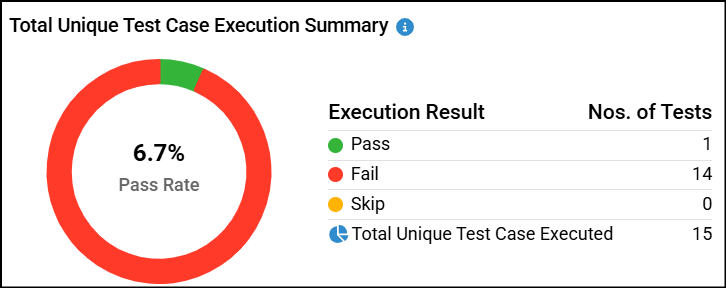
Total Unique Test Case Execution Summary
This section displays:
- Pass Rate (%): The percentage of test cases that passed.
- Execution Results: The number of test cases that Passed, Failed, or Skipped.
- Total Unique Test Cases Executed: The total number of unique test cases that were executed.
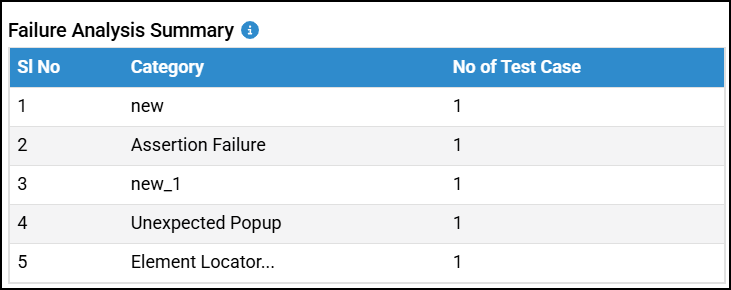
Failure Analysis Summary
This section displays the number of test cases that failed in each category within a batch.
Auto-Healing Insights
This section displays Auto-Healing accuracy in percentage, number of steps analyzed, number of steps passed and failed, Total AutoHeal Test Case, and manual review needed.
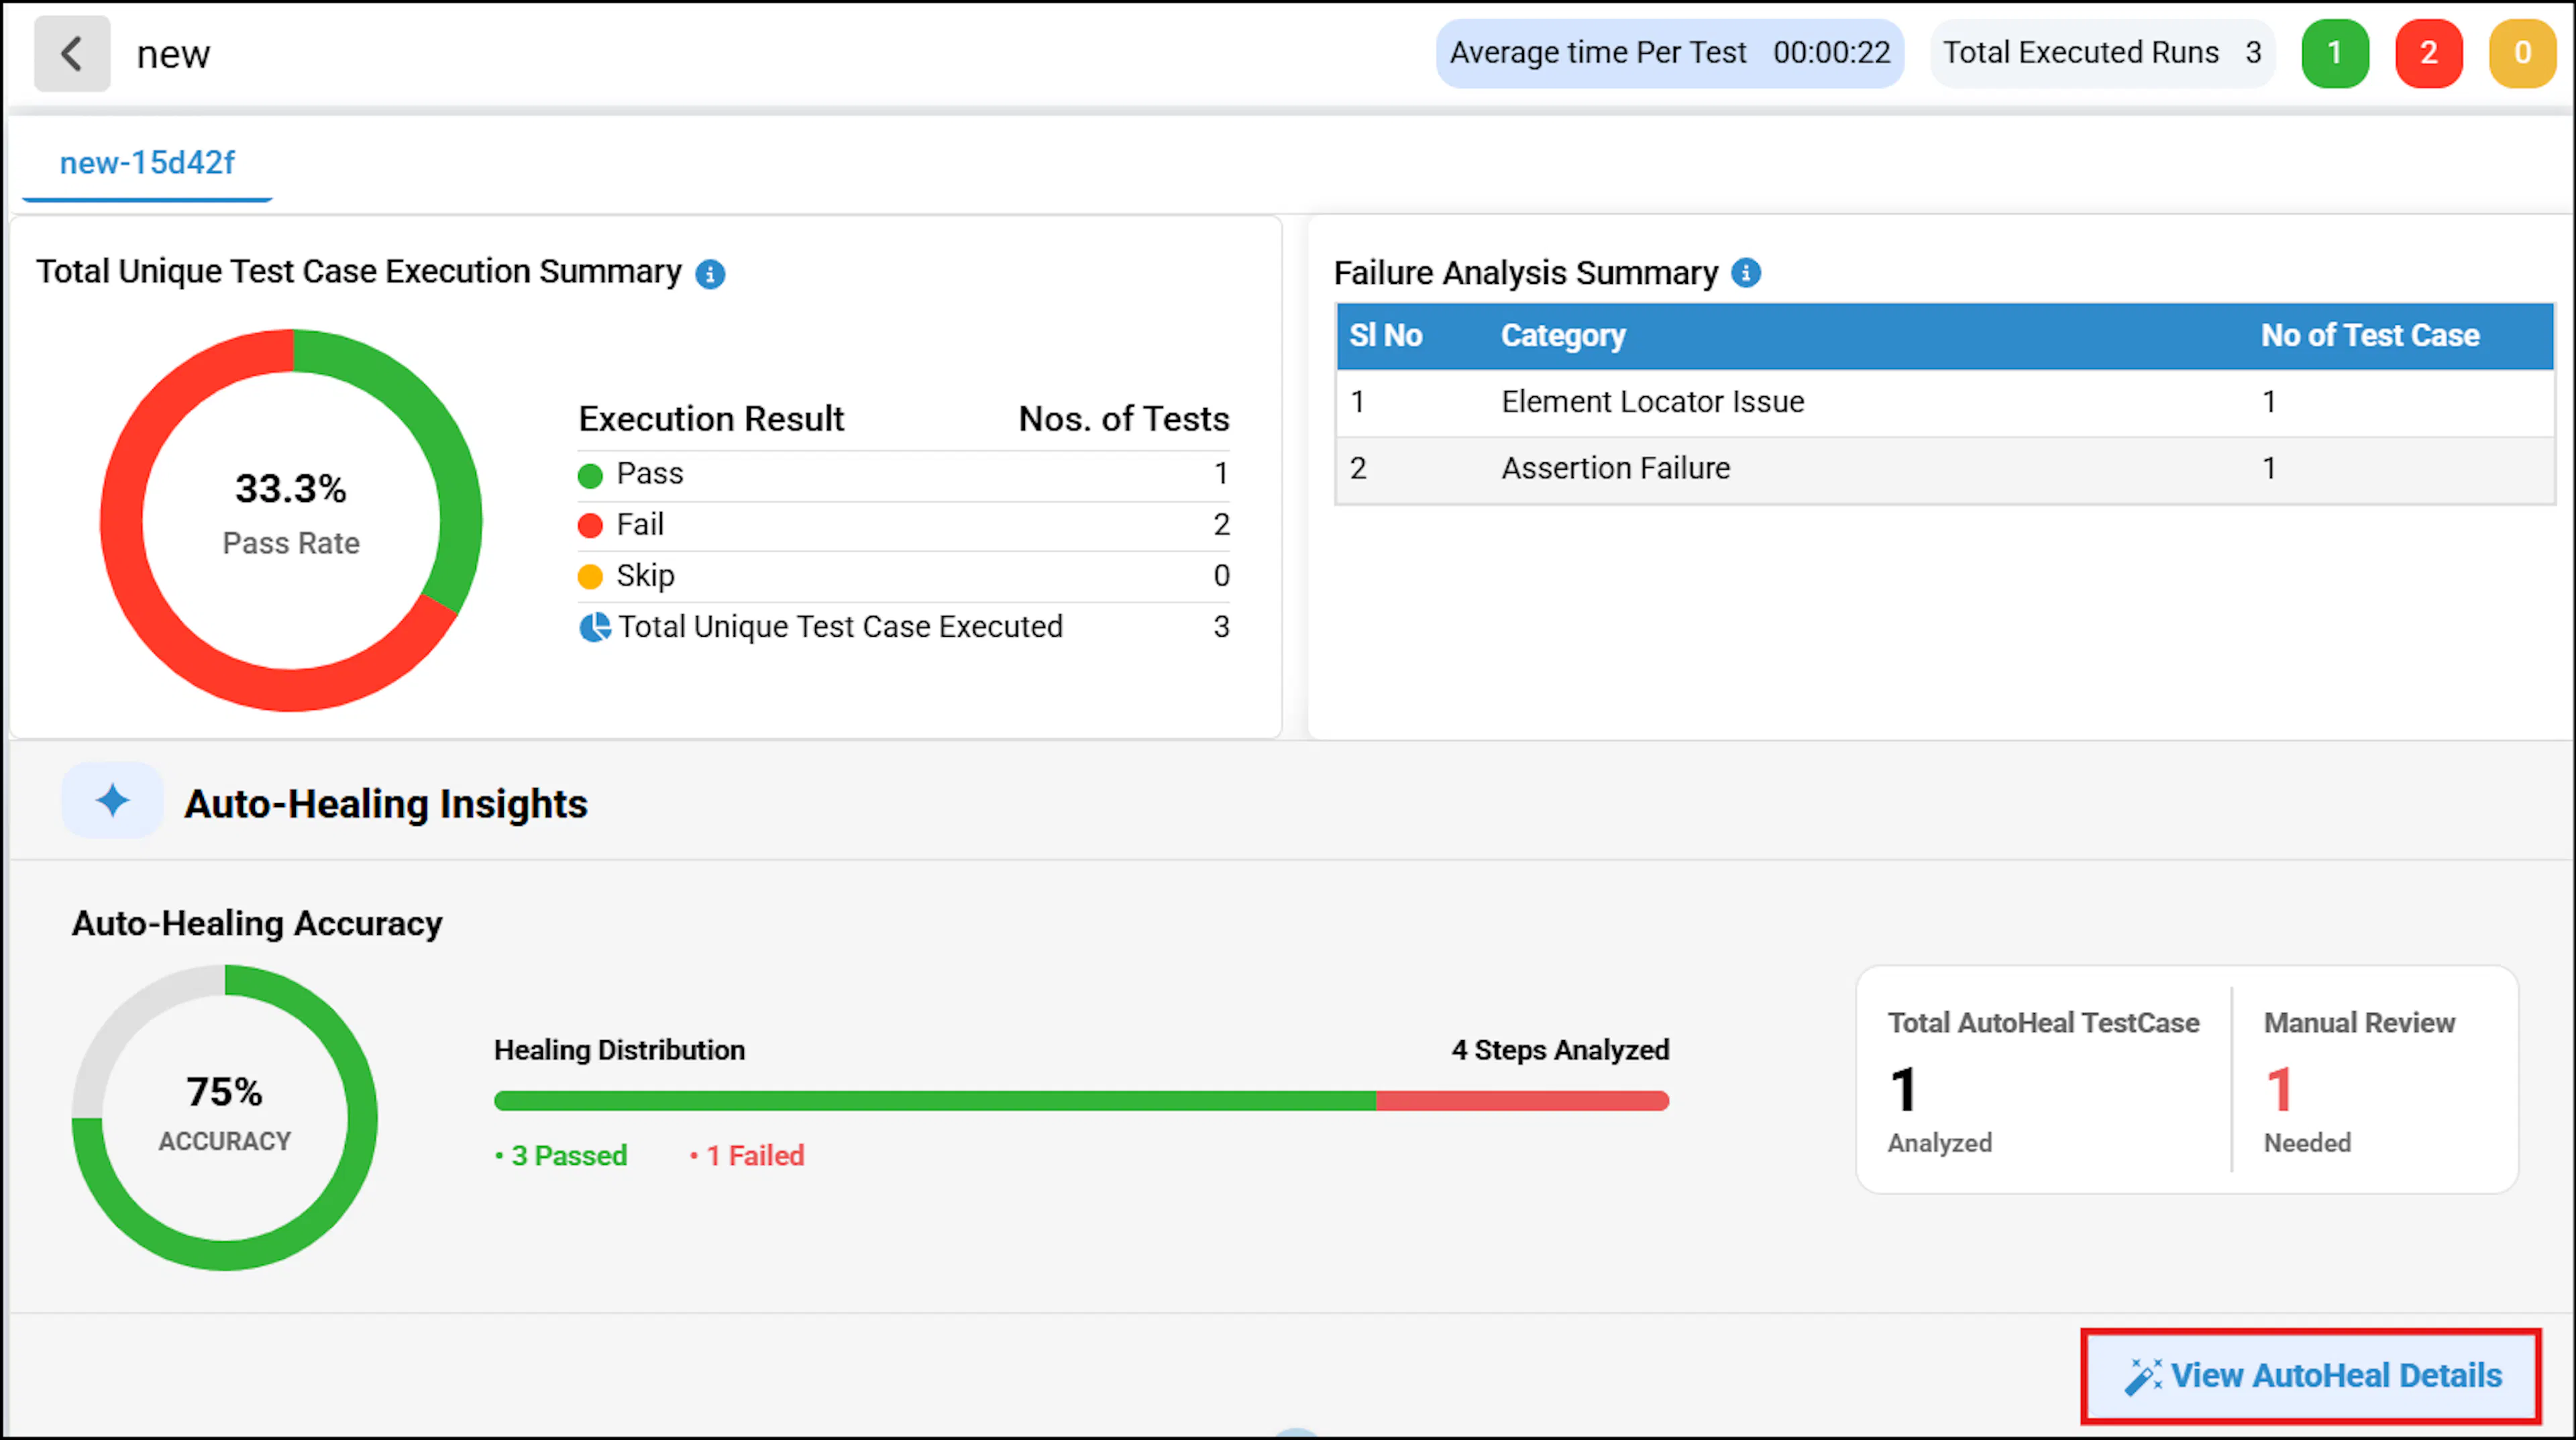
Click View AutoHeal Details to open the All TestCases table, which shows Scenario Id under Test Case Name, Tags used in the Test case, Total AutoHealed Steps, and Status.
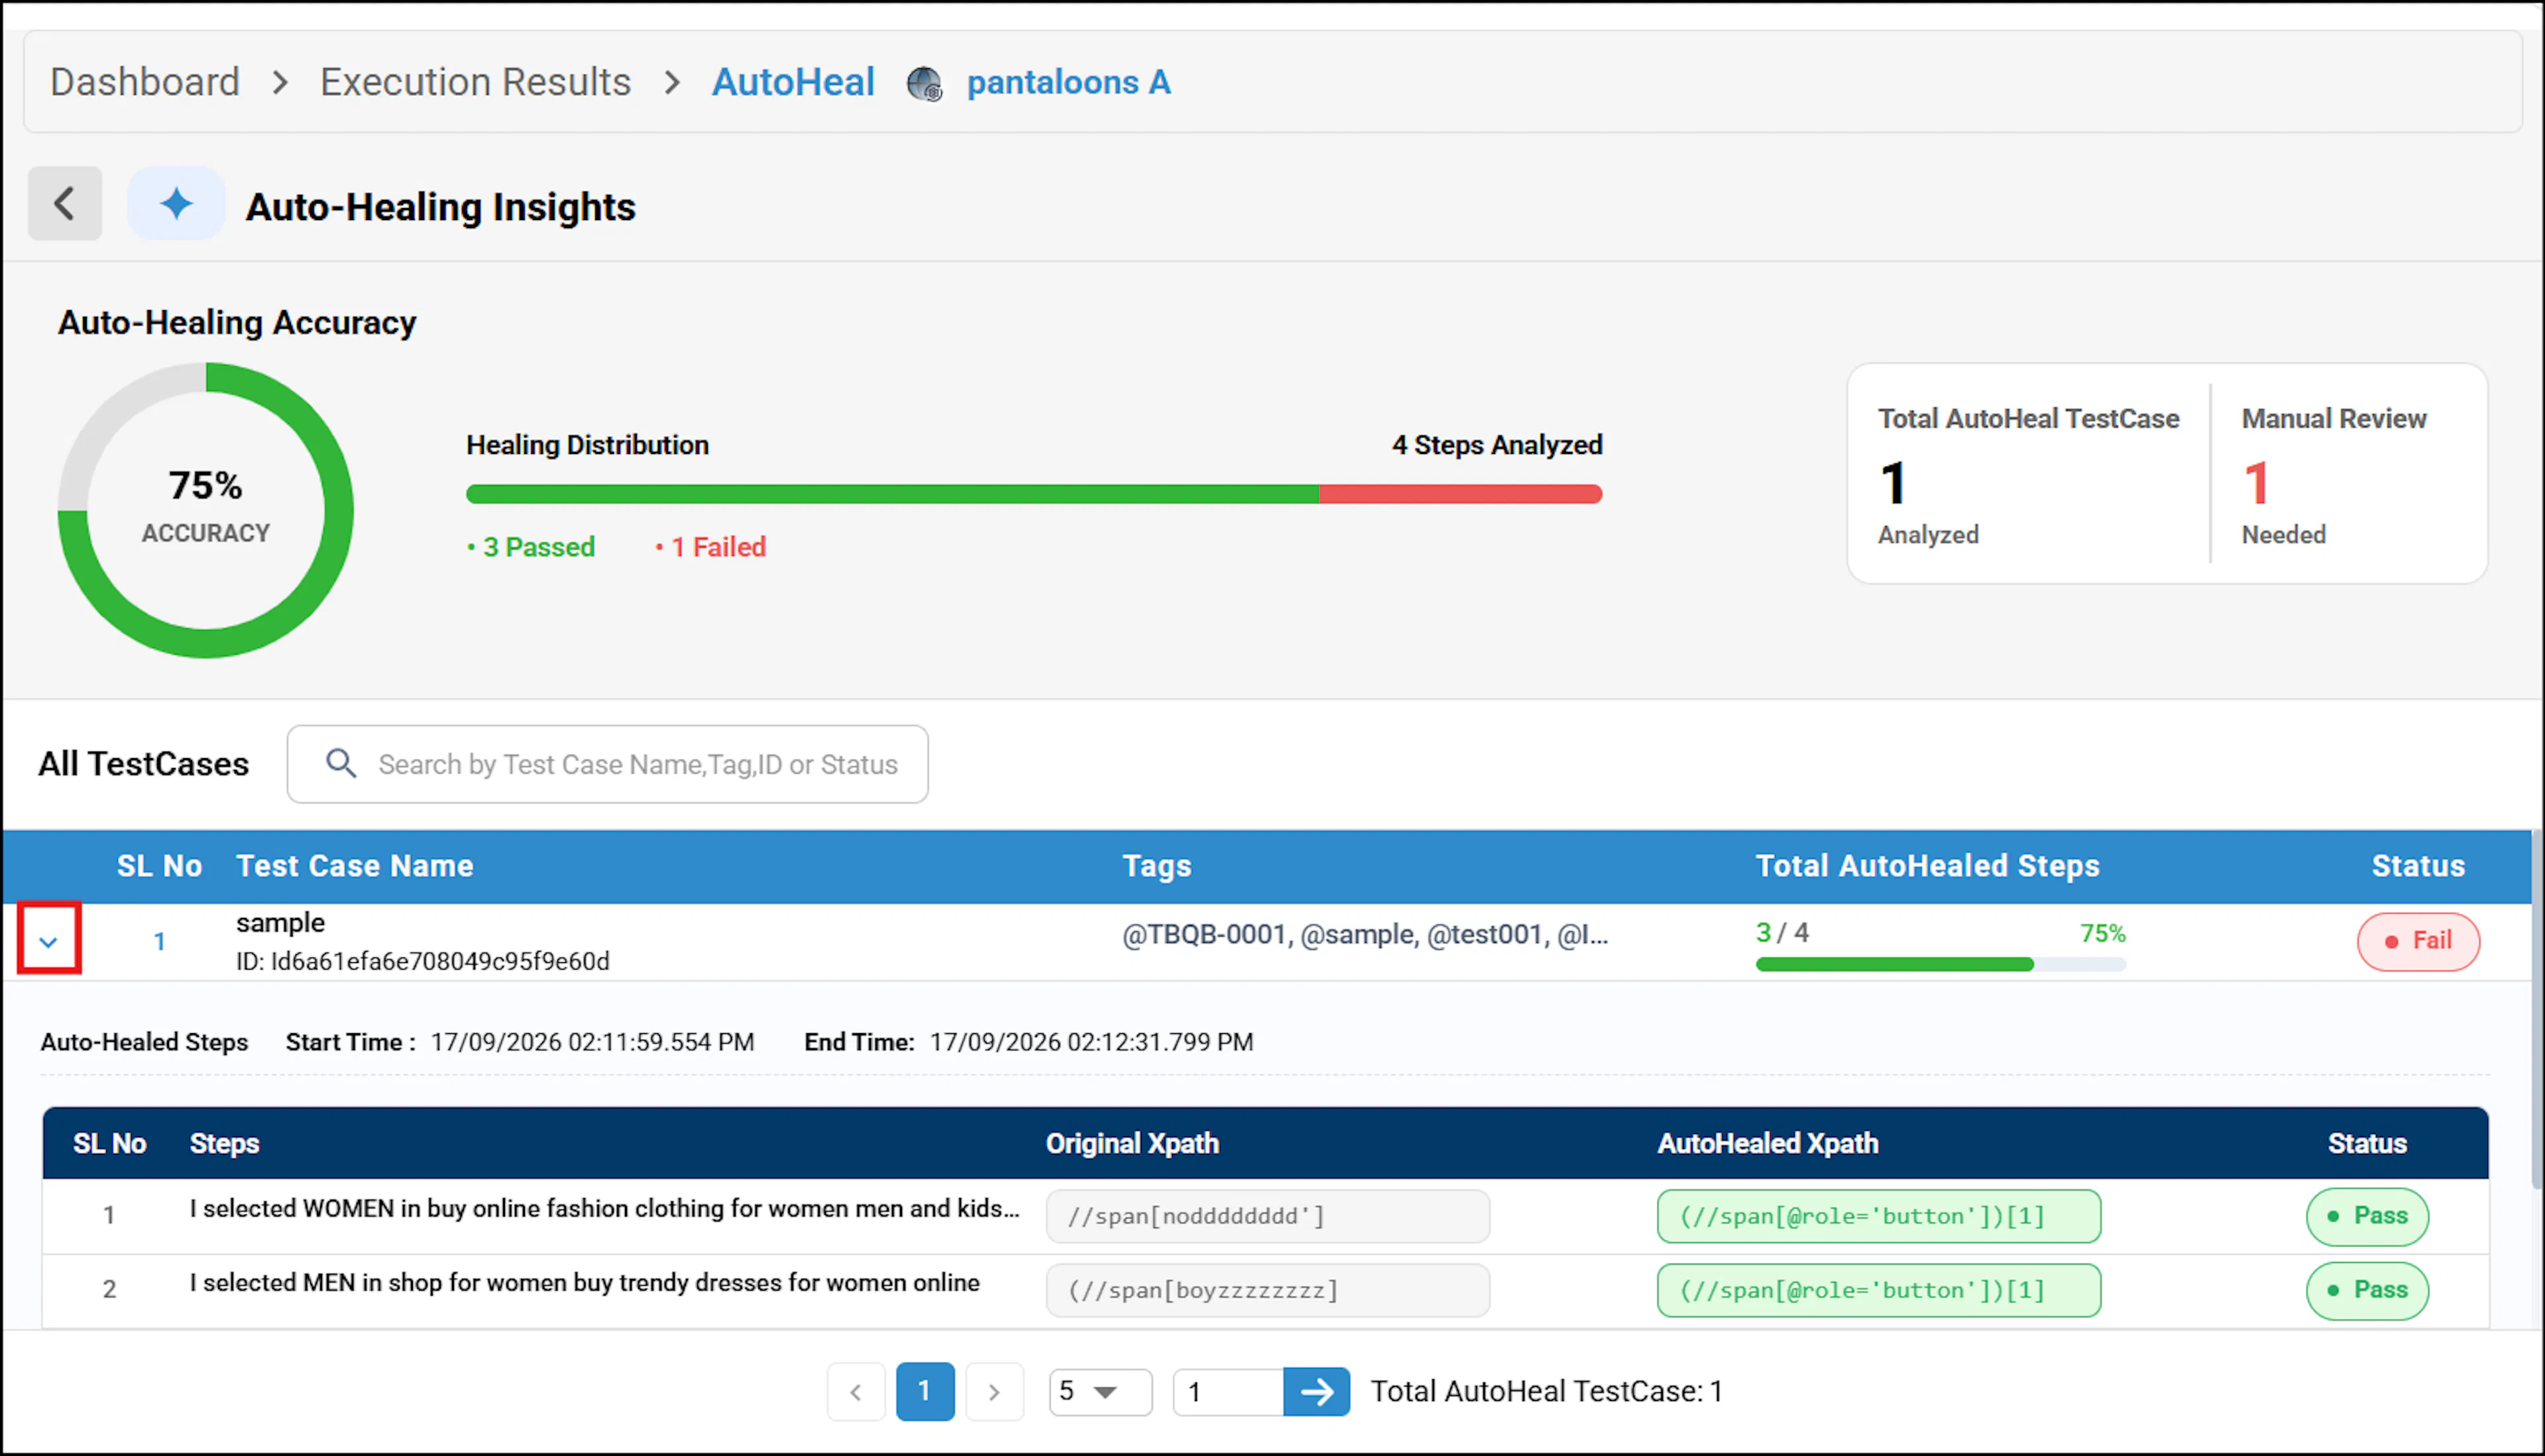
Click the dropdown icon beside the test cases to view Auto-Healed Steps Start Time and End Time, followed by a table with all the Steps, Original XPath, Auto-Healed XPath, and Status.
Failure Analysis
This section displays the details of each test case within the selected batch. Failed test cases are grouped by failure category and listed in the Category List. Selecting a category displays all failed test cases associated with that category.
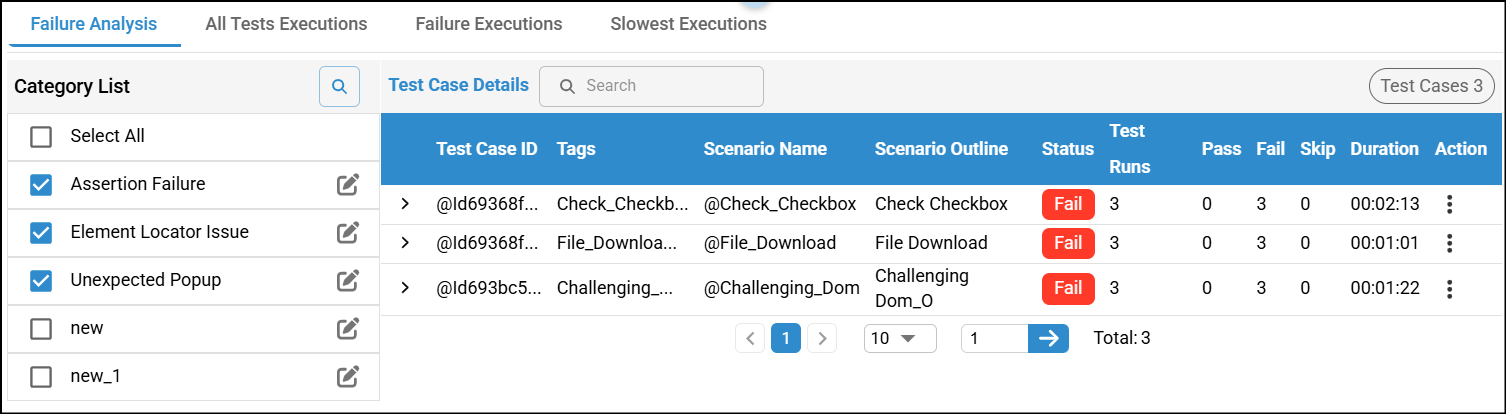
You can also edit a category name if it is not relevant by clicking the Edit icon next to the category. If a test case requires a new category, click the More icon (three dots) and add a new category for that test case.
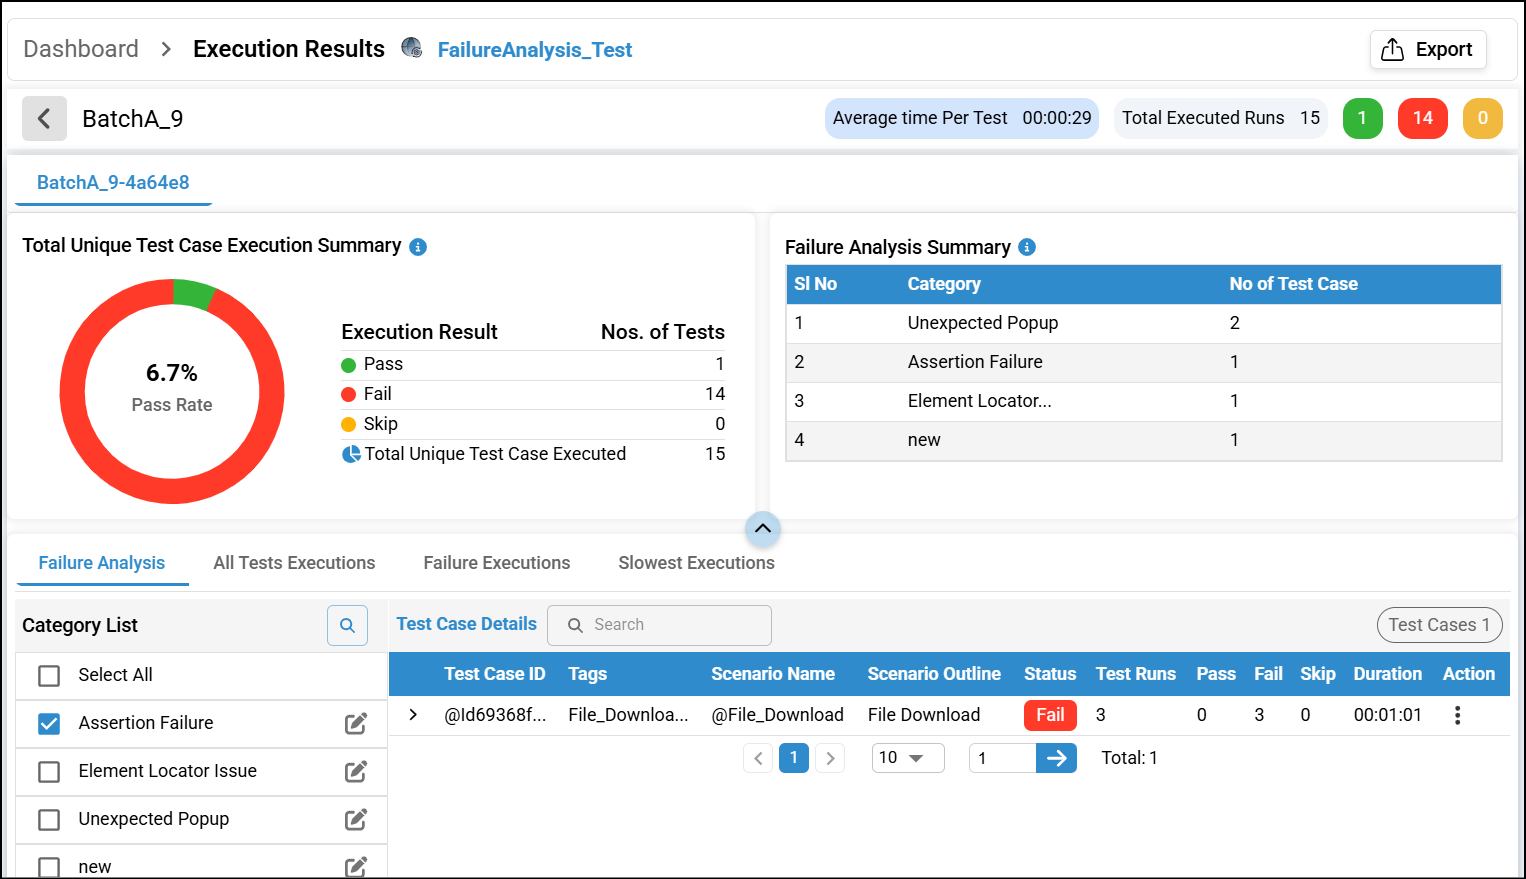
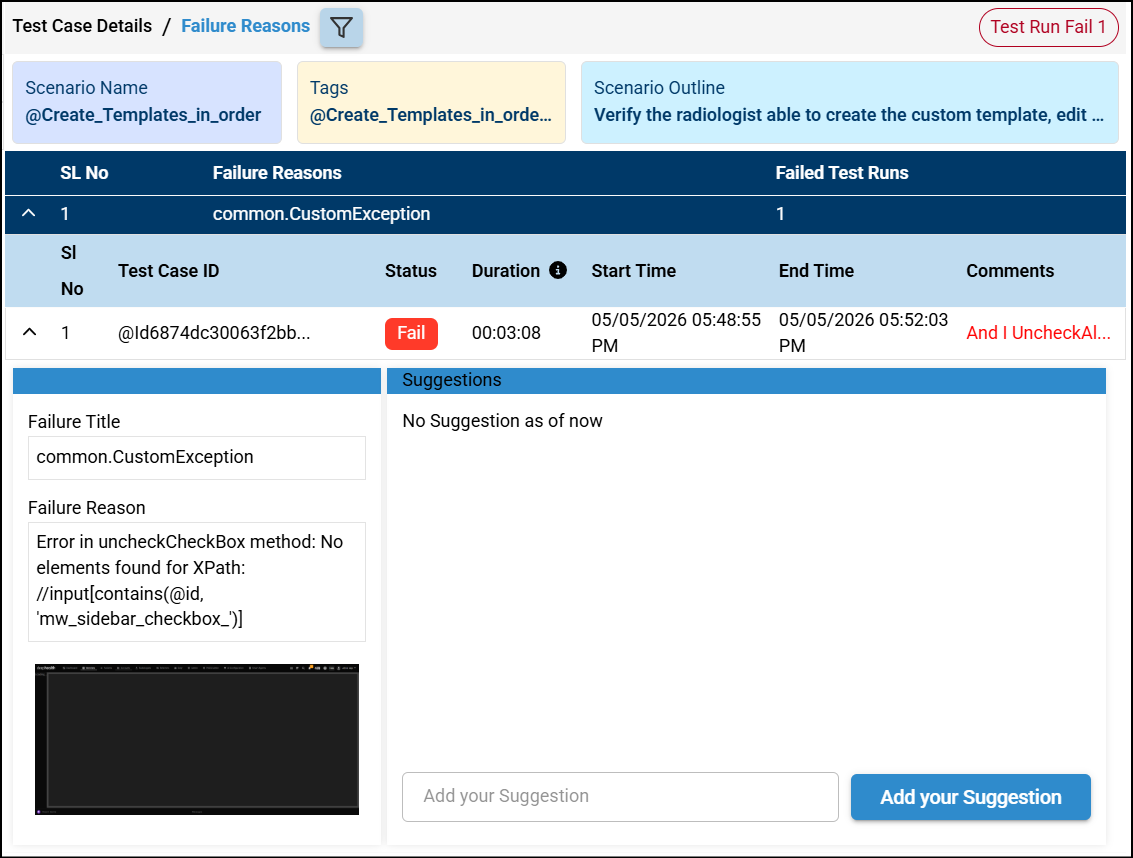
Click a test case to view the failure reason, number of test runs, and details such as scenario name, tags, and scenario outline. You can also use the Filter option to filter test cases by failure reason. If a test case has multiple failure reasons, all applicable reasons will be displayed.
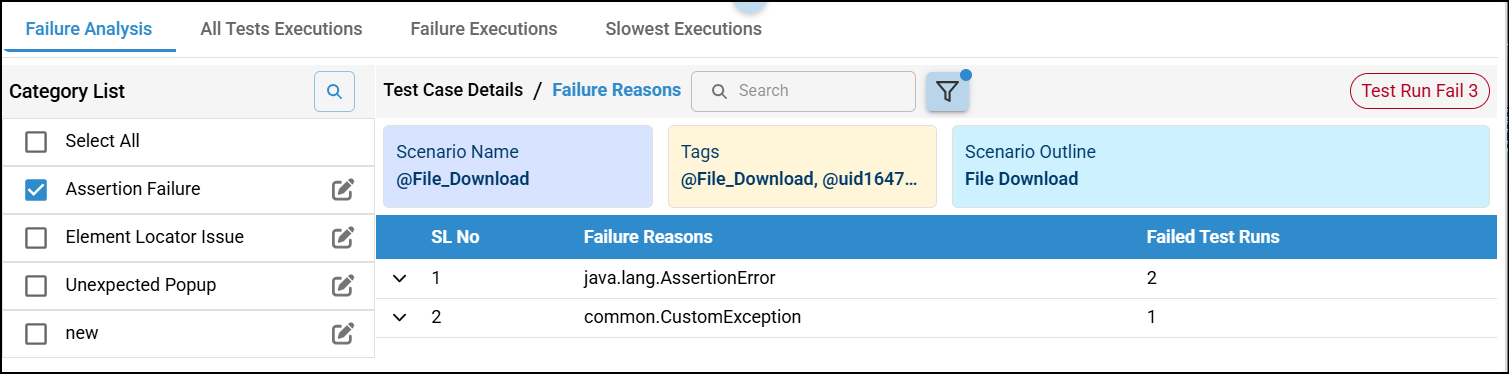
Click a failure reason to display the corresponding test case ID. Selecting the Test Case ID opens the detailed failure information, including the last screenshot of a failed test case highlighting the exact point of failure. You can also add suggestions to help improve or resolve the issue. Click the image to enlarge it and view it in a maximized mode.
The last screenshot of a failed test case is available only for the following automation types and frameworks:
Web Automation:
- Java Selenium
- Python Selenium
- TypeScript Playwright
- JavaScript Selenium
Mobile Automation:
- Python Appium
- TypeScript Playwright
All Test Executions
This section displays all the test executions under the selected batch.
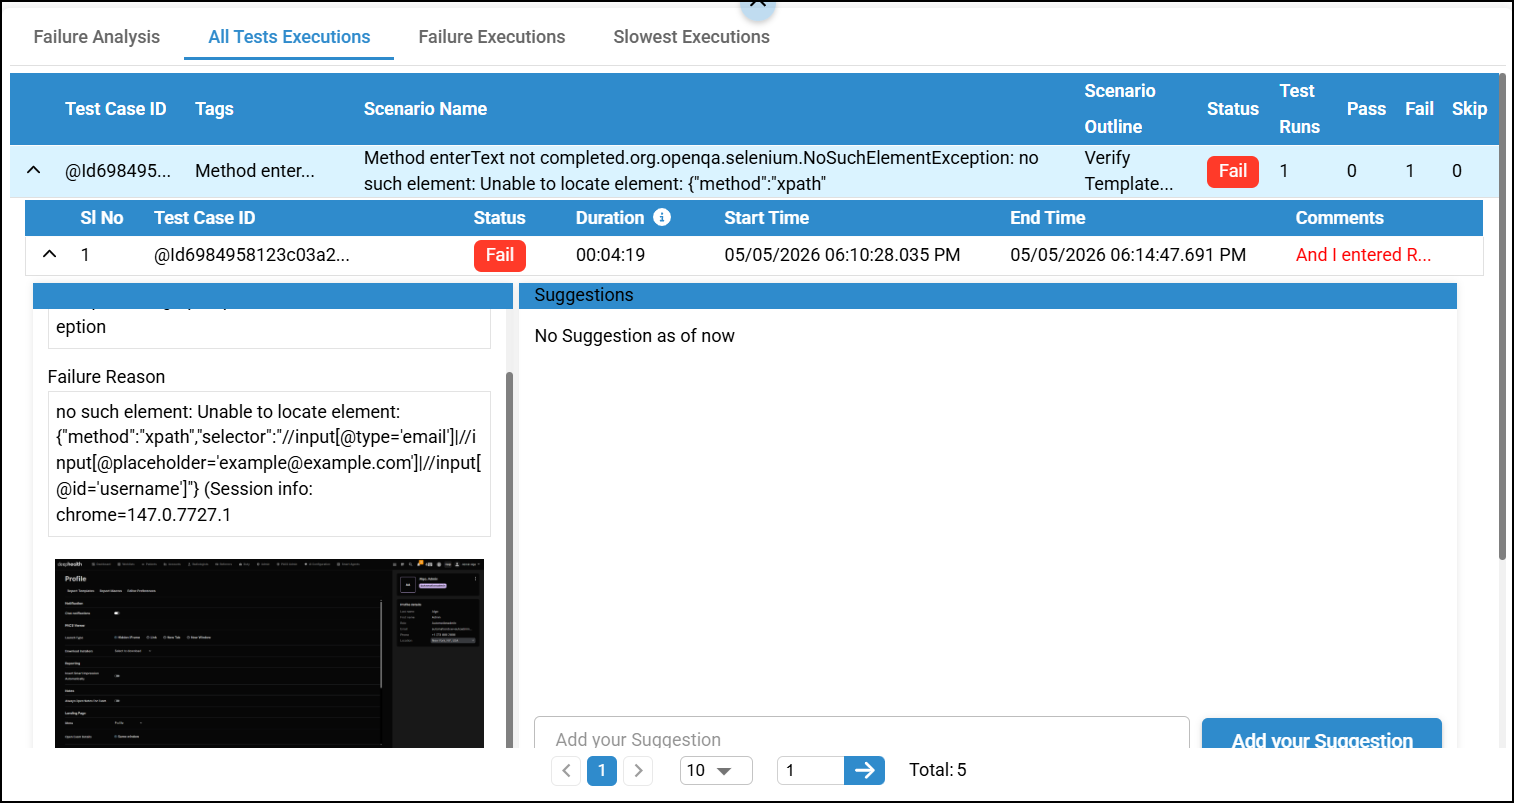
Click the down arrow of a test case to view the result of every run of that particular test case, see the reason for any failures along with a screenshot, and provide suggestions if needed.
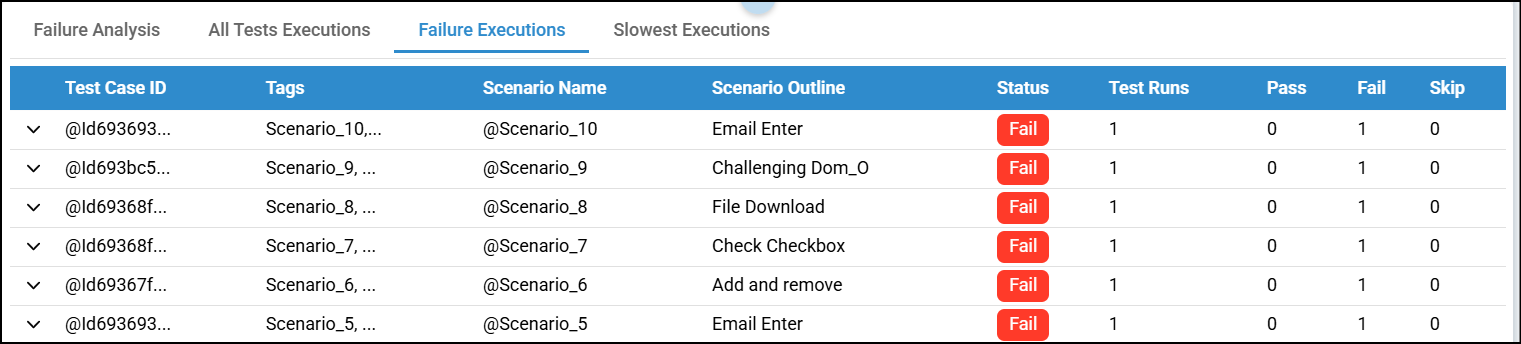
Failure Executions
This section displays the failed test executions under the selected batch.
Slowest Executions
This section displays the slowest test executions under the selected batch.

You can use the expand arrow to enlarge the table for a better view, which will hide the Total Unique Test Case Execution Summary and Failure Analysis Summary. Click the collapse arrow to view the summaries again.
Exporting Failure Analysis
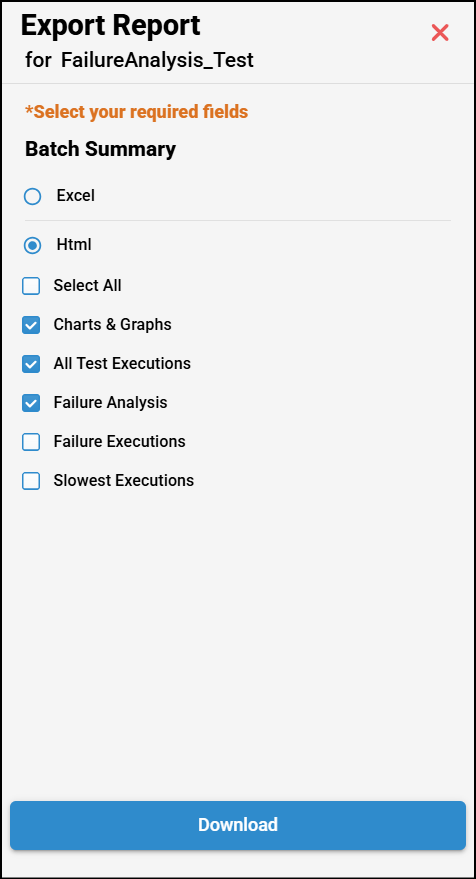
An Export option is available for Failure Analysis in the top-right corner. The details of the selected batch can be exported in Excel or HTML format.
- HTML Export: By default, Charts & Graphs, All Test Executions, and Failure Analysis are selected.
- Additional Options: You can also choose Failure Executions and Slowest Executions.
Select or deselect the desired options and click Download to export.