Scraping User Interface ElementsWebsite Performance Monitoring using PingLink
Website Performance Monitoring using PingLink
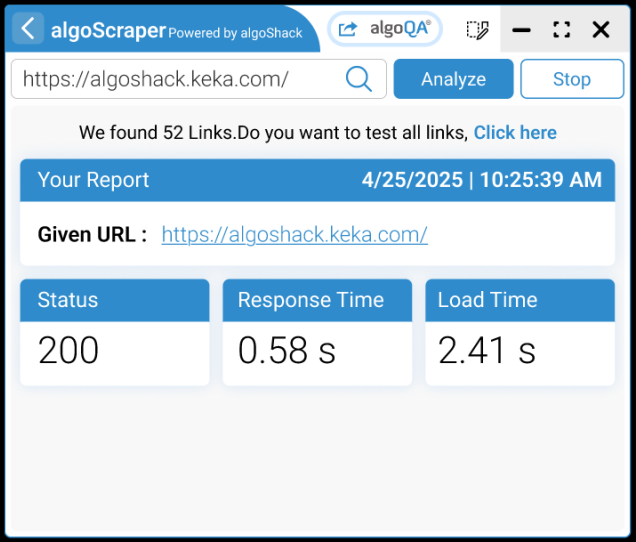
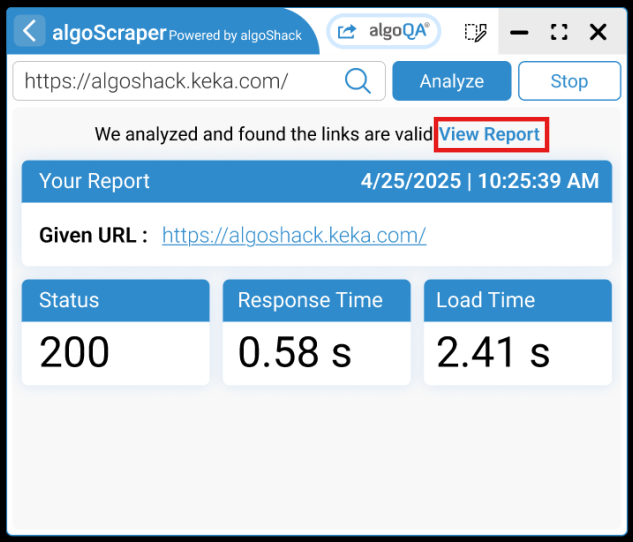
The PingLink capability is integrated with algoScraper extension, which helps generate reports and allows you to assess how well a website or application is performing. It displays metrics, such as response status code, response time and page load speed along with the provided URL, date.
PingLink capability is applicable only to web applications.
Tool Functionality Summary for PingLink Option
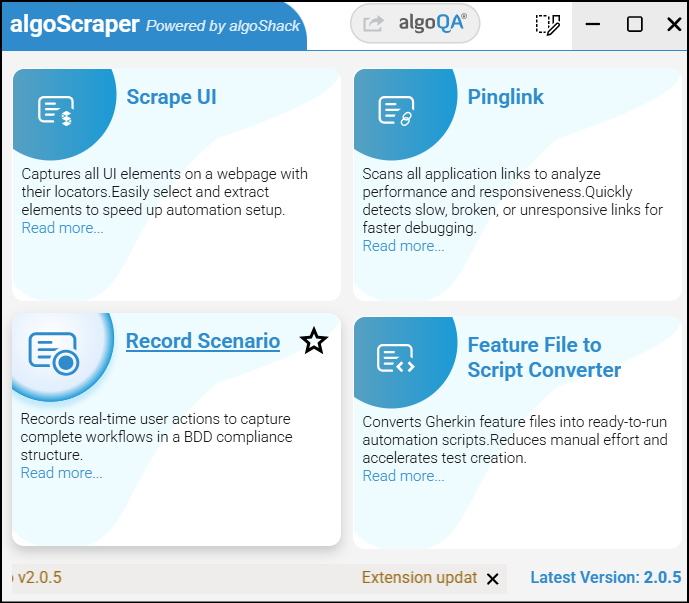
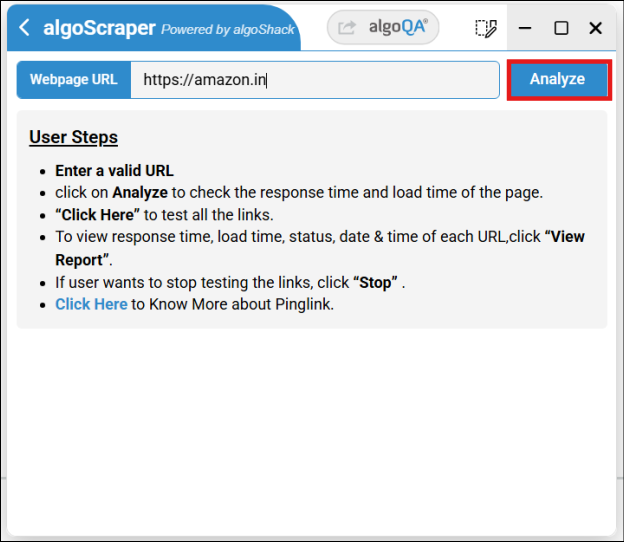
Click the PingLink feature in algoScraper. Enter the Webpage URL and click Analyze.
This helps in finding the issues in a given application. By keeping track of these metrics, you can make sure your web services are performing well. Click the 'Click here' link if you wish to test all the available links. If you wish to stop the analysis at any point, click the 'Stop' button.
The following table provides a brief description of the functionalities available in the PingLink option:
Displays the Page name URL which is being analyzed.
Date: 25/04/2025
Displays the date of the application analysis in MM/DD/YYYY format.
Time: 10:25:39 AM
Displays the time of the application analysis in HH: MM format.
Response Status CodeInforms you if a web request was successful or if there was a problem.Helps identify and fix errors (like broken pages or server issues) and check if everything is working as intended.
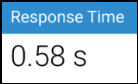
Response TimeMeasures how quickly a server responds to a request.If responses are slow, it might mean the server needs more resources or optimization.
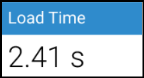
Load TimeIndicates how long it takes for a web page or application to fully load.Ensures that users don't have to wait long for pages to load. It helps improve the overall user experience by making sure everything loads quickly.
Viewing the Reports
After analyzing, you can view the report.
In the preceding screen, you can:
View the report by clicking the View Report link.
The system generates a report as follows:
In the Website Performance Data screen, you can download the report in the CSV format by clicking the Download CSV button. A sample report downloaded is as follows: